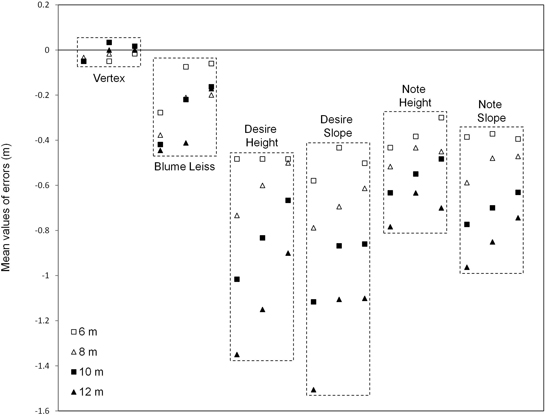
Fig. 1. Mean values of errors (6 repetitions) before calibration, for each hypsometer and height (6 m, 8 m, 10 m and 12 m). Desire = HTC Desire; Note = Samsung Galaxy Note; Height = Tool Height (Smart Tools); Slope = Tool Slope (Smart Tools). The data on the left for each hypsometer (dashed box) correspond to a distance of 10 m; those in the centre to 15 m; and those on the right to 20 m.
| Table 1. Modulus of the relative errors of the height measurements of the hypsometers (with and without calibration of the smartphones). | ||||||||
| Hypsometer | Cal. | n | Mean (%) | Median (%) | SD (%) | 95% CI (%) | nFIA | %FIA |
| Vertex | 72 | 0.80 | 0.83 | 0.86 | 0.60, 1.00 | 72 | 100 | |
| Blume Leiss | 72 | 2.96 | 2.96 | 1.66 | 2.58, 3.35 | 72 | 100 | |
| Desire, Height | N | 72 | 8.38 | 8.33 | 1.77 | 7.94, 8.83 | 62 | 86.1 <> |
| Desire, Slope | N | 72 | 9.24 | 9.09 | 1.99 | 8.68, 9.79 | 51 | 70.8 <> |
| Note, Height | N | 72 | 5.87 | 6.00 | 1.26 | 5.57, 6.16 | 72 | 100 |
| Note, Slope | N | 72 | 6.73 | 6.66 | 1.13 | 6.47, 7.00 | 72 | 100 |
| Desire, Height | Y | 72 | 1.38 | 1.27 | 0.98 | 1.15, 1.61 | 72 | 100 |
| Desire, Slope | Y | 72 | 3.14 | 3.22 | 1.74 | 2.73, 3.55 | 71 | 98.6 |
| Note, Height | Y | 72 | 1.18 | 1.01 | 1.00 | 0.95, 1.41 | 72 | 100 |
| Note, Slope | Y | 72 | 2.41 | 2.36 | 1.03 | 2.17, 2.65 | 72 | 100 |
| Cal. = calibrated (N = no; Y = yes); n = number of height measurements; SD = standard deviation; 95% CI = confidence interval at the 95% confidence level; nFIA = number of measurements that fulfil the FIA criterion; %FIA = percentage of measurements that fulfil the FIA criterion. <> = Does not fulfil the FIA quality criterion. | ||||||||
| Table 2. Relative errors of the height measurements of the hypsometers (with and without calibration of the smartphones). | |||||||
| Hypsometer | Cal. | n | Mean (%) | Median (%) | SD (%) | 95% CI (%) | RMSE |
| Vertex | 72 | –0.25 | 0.00 | 1.15 | –0.52, 0.02 | 0.0117 | |
| Blume Leiss | 72 | –2.78 | –2.81 | 1.96 | –3.23, –2.32 | 0.0339 | |
| Desire, Height | N | 72 | –8.38 | –8.33 | 1.77 | –8.80, –7.97 | 0.0856 |
| Desire, Slope | N | 72 | –9.24 | –9.09 | 1.99 | –9.70, –8.77 | 0.0945 |
| Note, Height | N | 72 | –5.87 | –6.00 | 1.26 | –6.16, –5.57 | 0.0600 |
| Note, Slope | N | 72 | –6.73 | –6.66 | 1.13 | –7.00, –6.47 | 0.0683 |
| Desire, Height | Y | 72 | 0.54 | 0.46 | 1.61 | 0.17, 0.92 | 0.0169 |
| Desire, Slope | Y | 72 | –3.13 | –3.22 | 1.77 | –3.54, –2.72 | 0.0359 |
| Note, Height | Y | 72 | –0.61 | –0.58 | 1.42 | –0.95, –0.28 | 0.0154 |
| Note, Slope | Y | 72 | –2.41 | –2.36 | 1.03 | –2.65, –2.17 | 0.0262 |
| Cal. = calibrated (N = no; Y = yes); n = number of height measurements; SD = standard deviation; 95% CI = confidence interval at the 95% confidence level; RMSE = root-mean-square error. | |||||||
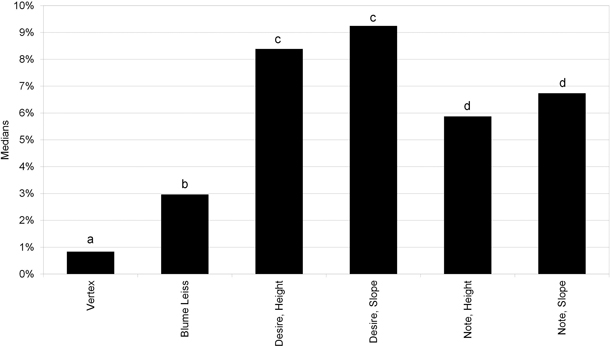
Fig. 2. Medians of the modulus of the relative errors before calibration. Desire = HTC Desire; Note = Samsung Galaxy Note; Height = Tool Height (Smart Tools); Slope = Tool Slope (Smart Tools). Medians of hypsometers without a common letter are significantly different at p = 0.05.
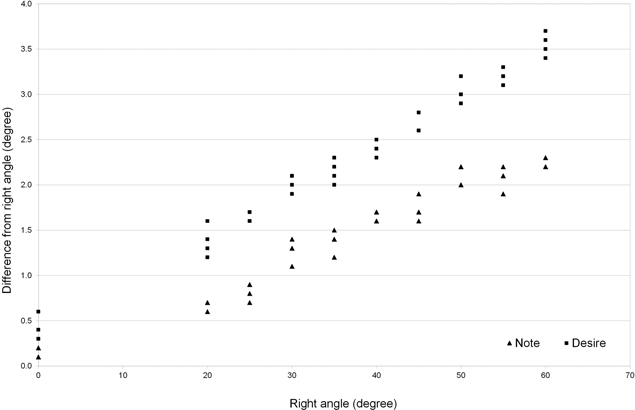
Fig. 3. Differences between the smartphone readings (measured on axis Z) and those of the Digital Angle Finder (Right angle).
| Table 3. Regression models of the smartphones and the Digital Angle Finder. | |||||
| Smartphone | Axis | Regression model | R2 | P-values | |
| Intercept | Coefficient | ||||
| Note | Y | f(y) = 1.04471y + 0.35464 | 0.99925 | <0.0001 | <0.0001 |
| Note | Z | f(z) = 1.03904z + 0.05963 | 0.99993 | 0.263 | <0.0001 |
| Desire | Y | f(y) = 1.09512y – 1.84003 | 0.99952 | <0.0001 | <0.0001 |
| Desire | Z | f(z) = 1.05483z + 0.39165 | 0.99995 | <0.0001 | <0.0001 |
| Note = Samsung Galaxy Note; Desire = HTC Desire. y, z = angles obtained with the smartphone. f(y), f(z) = corrected estimated angles. | |||||
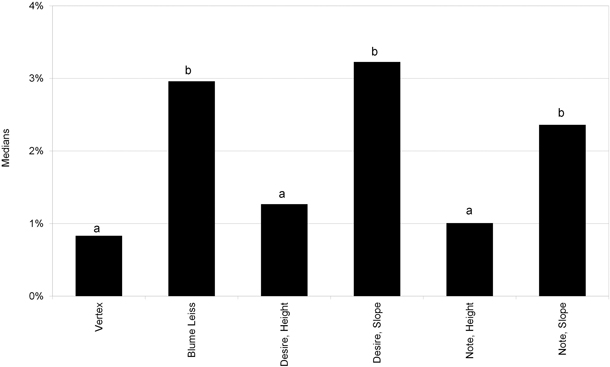
Fig. 4. Medians of the modulus of the relative errors after calibration. Desire = HTC Desire; Note = Samsung Galaxy Note; Height = Tool Height (Smart Tools); Slope = Tool Slope (Smart Tools). Medians of the hypsometers without a common letter are significantly different at p = 0.05.