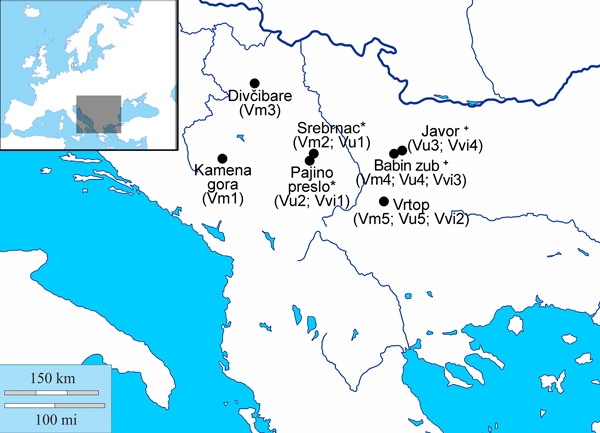
Fig. 1. Sites within the central Balkans from which populations of V. myrtillus, V. uliginosum and V. vitis-idaea were sampled. The list of populations sampled from each site is given in brackets; * - sites found at Mt Kopaonik; + - sites found at Mt Stara planina.
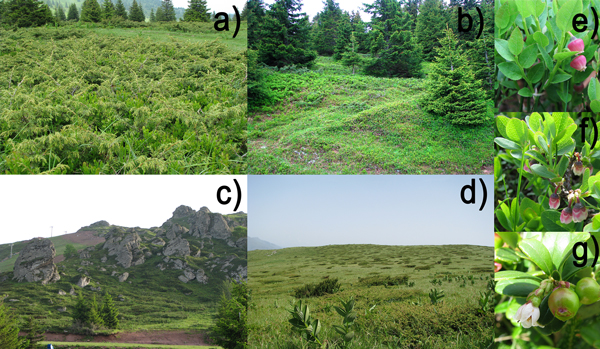
Fig. 2. Localities at Mts Kopaonik (a and b) and Stara planina (c and d) at which populations of Vaccinium myrtillus (e), Vaccinium uliginosum (f) and Vaccinium vitis-idaea (g) are found; a) locality Srebrnac, with populations Vm2 and Vu1; b) locality Pajino preslo, with populations Vu2 and Vvi1; c) locality Babin zub, with populations Vm4, Vu4 and Vvi3; d) locality Javor, with populations Vu3 and Vvi4.
| Table 1. Sampling localities of populations of three Vaccinium species from the Balkans, sample sizes, and parameters of genetic diversity at the population and at the species level. View in new window/tab. |
| Table 2. Characteristics of nine decamer primers used for RAPD-PCR analyses in three Vaccinium species from the Balkans. | ||||
| PIC values | ||||
| Primer name | Primer sequence (5’–3’) | V. myrtillus | V. uliginosum | V. vitis – idaea |
| OPA-05 | AGGGGTCTTG | 0.291 | 0.283 | 0.285 |
| OPA-07 | GAAACGGGTG | 0.246 | 0.338 | 0.292 |
| OPA-09 | GGGTAACGCC | 0.264 | 0.314 | 0.319 |
| OPA-10 | CTGATCGCAG | 0.224 | 0.282 | 0.311 |
| OPA-11 | CAATCGCCGT | 0.277 | 0.261 | 0.307 |
| OPA-13 | CAGCACCCAC | 0.342 | 0.320 | 0.323 |
| OPA-15 | TTCCGAACCC | 0.280 | 0.298 | 0.287 |
| OPO 7 | CAGCACTGAC | 0.302 | 0.303 | 0.303 |
| OPO 15 | TGGCGTCCTT | 0.227 | 0.303 | 0.303 |
| Average | 0.273 | 0.300 | 0.303 | |
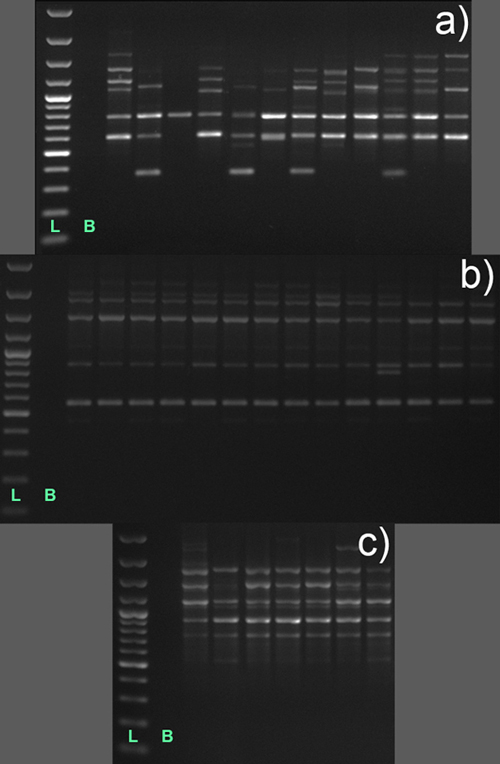
Fig. 3. RAPD banding patterns on 1% agarose gels obtained upon PCR amplification with two decamer primers, OPA 07 (a) and OPA 15 (b and c), in individuals of three Vaccinium species; a – Vaccinium myrtillus, population Vm2 represented by 12 individuals; b – Vaccinium uliginosum, Vu1, 14 individuals; and c – Vaccinium vitis-idaea, Vvi3, 7 individuals; each lane represents a banding pattern in different individual; L – 1 kb DNA ladder; B – blank.
| Table 3. Pairwise population FST values (below diagonals), average FST values at the species level, and geographic distances among populations of three Vaccinium species from the Balkans given in km (above diagonals). | ||||||
| Vaccinium myrtillus | ||||||
| Vm1 | Vm2 | Vm3 | Vm4 | Vm5 | ||
| Vm1 | 100.65 | 95.30 | 243.40 | 230.73 | ||
| Vm2 | 0.392 | 110.49 | 143.15 | 142.25 | ||
| Vm3 | 0.349 | 0.258 | 226.03 | 240.03 | ||
| Vm4 | 0.465 | 0.467 | 0.347 | 69.50 | ||
| Vm5 | 0.549 | 0.510 | 0.465 | 0.502 | ||
| Average FST: 0.430 | ||||||
| Vaccinium uliginosum | ||||||
| Vu1 | Vu2 | Vu3 | Vu4 | Vu5 | ||
| Vu1 | 4.72 | 172.65 | 143.32 | 138.07 | ||
| Vu2 | 0.602 | 173.75 | 145.39 | 137.19 | ||
| Vu3 | 0.557 | 0.517 | 35.77 | 65.05 | ||
| Vu4 | 0.624 | 0.591 | 0.496 | 69.50 | ||
| Vu5 | 0.696 | 0.686 | 0.495 | 0.577 | ||
| Average FST: 0.584 | ||||||
| Vaccinium vitis-idaea | ||||||
| Vvi1 | Vvi2 | Vvi3 | Vvi4 | |||
| Vvi1 | 137.19 | 145.39 | 173.75 | |||
| Vvi2 | 0.552 | 69.50 | 65.05 | |||
| Vvi3 | 0.550 | 0.492 | 35.77 | |||
| Vvi4 | 0.524 | 0.498 | 0.505 | |||
| Average FST: 0.520 | ||||||
| FST values significant at 95% level are presented in bold | ||||||
| Table 4. Outcomes of AMOVA analyses in three Vaccinium species at the ramet and at the genet level. View in new window/tab. |
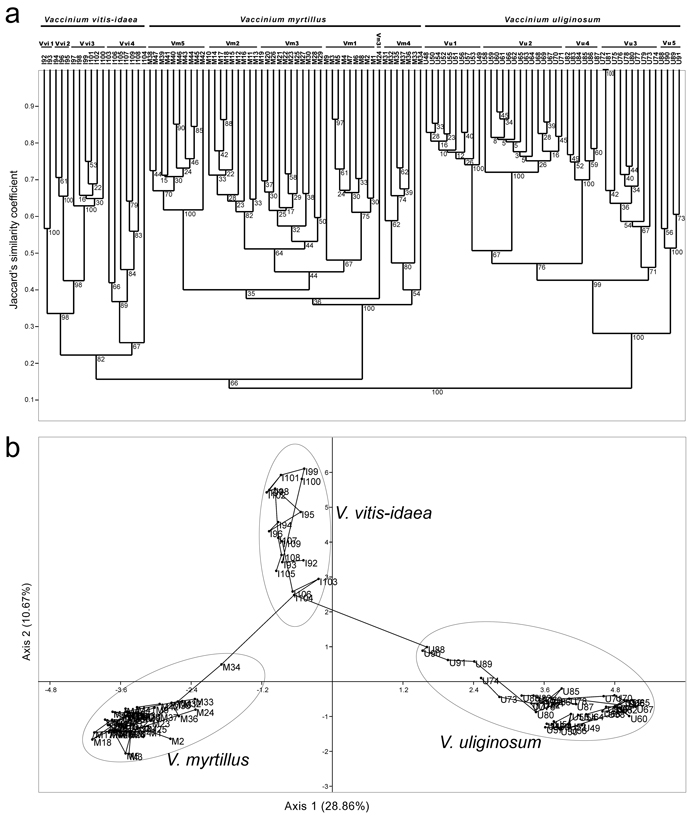
Fig. 4. Dendrogram generated with UPGMA method based on Jacquard’s similarity coefficients among 109 RAPD multilocus phenotypes of three Vaccinium species (a), and outcomes of PCA analysis based on pairwise population Jaccard’s similarity coefficients (b). View larger in new window/tab.
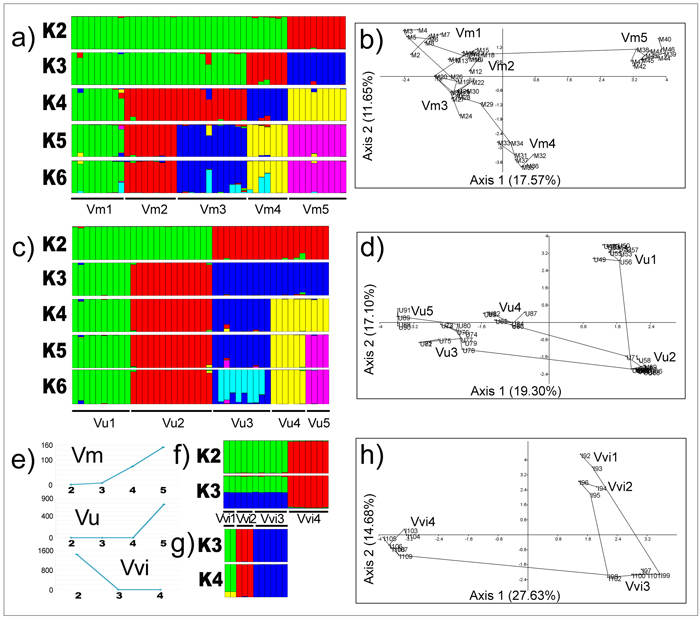
Fig. 5. Outcomes of Bayesian clustering of populations (a – V. myrtillus; c – V. uliginosum; f – V. vitis-idaea represented by all populations; g – V. vitis-idaea represented by populations Vvi1, Vvi2 and Vvi3), the optimal number of genetic groups in all species as inferred by Evanno’s method (e), and outcomes of PCA analyses based on pairwise population Jaccard’s similarity coefficients at the species level (b – V. myrtillus; d – V. uliginosum; h – V. vitis-idaea). View larger in new window/tab.