| Table 1. Land areas in 1000 ha, distributed on land use classes in Nordic and Baltic countries, but not including Iceland. | ||||||
| Country | Productive forest land | Other wooded land, poorly productive forest land, high altitude mountains, plateaus etc., naturally colonized and sparsely wooded land | Barren land, unproductive land, marsh/wetlands, wetlands, dunes etc., other land | Other land, agriculture, build-up areas, artificial, agricultural areas etc., agriculture land | Total land area | Productive forest land of total land area (%) |
| Denmark | 608 | 45 | 295 | 3361 | 4310 | 14.1 |
| Finland | 20 259 | 2518 | 3196 | 4442 | 30 414 | 66.6 |
| Norway | 11 622 | 15 638 | 1765 | 1400 | 30 425 | 38.2 |
| Sweden | 23 171 | 7245 | 4968 | 5346 | 40 729 | 56,9 |
| Estonia | 2212 | 79 | 604 | 1374 | 4269 | 51.8 |
| Latvia | 2974 1) | 113 2) | 946 2) | 2403 2) | 6448 2) | 46.1 |
| Lithuania | 2220 | 106 | 735 | 3467 | 6528 | 34.0 |
| Total | 63 066 | 25 744 | 12 509 | 21 793 | 123 123 | 51.2 |
| Sources: Danmarks Statistik (2012), Johannsen et al. (2013), Estonian Environment Information Centre (2012), Finnish Forest Research Institute (2012a), 1) mean value from Latvian State Forest Service (2012) and 2) Latvian State Land Service (2012), Lithuanian Ministry of Environment (2015), Statistics Norway (2011) and Swedish Forest Agency (2014) | ||||||
| Table 2. Annual current harvest potential of forest fuels in the Nordic and Baltic countries. Table revised from Rytter et al. (2015) with Lithuanian data from FAO (2016b). | ||||||
| Country | Potential with lowest level of restrictions | Potential with highest level of restrictions | ||||
| Mton DM | TWh | PJ | Mton DM | TWh | PJ | |
| Denmark | 2.3 | 11.5 | 42 | 1.0 | 5.1 | 18 |
| Finland | 35 | 186 | 670 | 22 | 117 | 420 |
| Norway | 5.1 | 27.1 | 98 | 3.8 | 20.4 | 74 |
| Sweden | 29.3 | 143.4 | 522 | 10.9 | 53.1 | 194 |
| Estonia1) | 3.2 | 16.8 | 62 | 1.7 | 9.1 | 33 |
| Latvia | 4.5 2) | 23.9 | 87 | n.a.3) | n.a.3) | n.a.3) |
| Lithuania | 1.4 4) | 7.4 | 27 | n.a.3) | n.a.3) | n.a.3) |
| Summary | 80.9 | 416 | 1508 | 45.4 | 236 | 854 |
| 1) = estimation according to scenarios of the Forestry Development Programme for the period 2011–2020. 2) = calculated backwards, 3) = the same value was used for lowest and highest restriction levels in the Summary row, n.a. = not available, 4) = calculated from FAO information. | ||||||
| Table 3. Primary production of renewable energy (TWh) in 2013. | ||||||
| Country | Total primary supply | Solar energy | Biomass and waste | Geothermic energy | Hydropower energy | Wind energy |
| Denmark | 37.7 | 0.8 | 25.7 | 0.1 | 0 | 11.1 |
| Finland | 115.5 | 0 | 101.9 | 0 | 12.8 | 0.8 |
| Norway | 144.9 | 0 | 14.5 | 0 | 128.5 | 1.9 |
| Sweden | 195.0 | 0.2 | 123.7 | 0 | 61.4 | 9.8 |
| Estonia | 13.0 | 0 | 12.4 | 0 | 0 | 0.5 |
| Latvia | 24.9 | 0 | 21.8 | 0 | 2.9 | 0.1 |
| Lithuania | 15.0 | 0 | 13.8 | 0 | 0.5 | 0.6 |
| Total | 546.0 | 1.0 | 313.8 | 0.1 | 206.1 | 24.8 |
| Source: Eurostat (2013): http://ec.europa.eu/eurostat/statistics-explained/index.php/File:Primary_production_of_renewable_energy,_2003_and_2013_YB15.png | ||||||
| Table 4. Growing stocks and areas of native and exotic tree species in the Nordic and Baltic countries. Table revised from Rytter et al. (2013) now including Lithuanian data. | ||
| Tree species | Growing stock, (million m3) | Area as dominant tree species (ha) |
| Native species | ||
| Norway spruce | >2800 | c. 19 million |
| Scots pine | c. 3500 | >30 million |
| Silver and downy birch | c. 1550 | c. 8 million |
| Black and grey alder | c. 380 | – |
| Aspen | >180 | – |
| Oak | >80 | – |
| Beech | >40 | – |
| Exotic species | ||
| Lodgepole pine | c. 30 | c. 600 000 |
| Sitka spruce | – | c. 85 000 |
| Douglas fir | – | >6000 |
| Grand fir | – | c. 3000 |
| Hybrid larch | c. 1.4 | – |
| Siberian larch | – | c. 30 000 |
| Populus (excl. P. tremula) | – | c. 5000 |
| Table 5. Estimated productivity of stem wood of selected trees species representing natural populations and present genetic gain representing populations originating from genetically improved trees. The values represent populations on suitable sites in the southern and central parts of the Nordic and Baltic region. Data taken from Rytter et al. (2013) and Haapanen et al. (2015). | |||||
| Tree species | MAI for “natural” stands (m3 ha–1 yr–1) | Present genetic gain (%) | MAI for improved plant material 4) (m3 ha–1 yr–1) | MAI for improved plant material 3) (Mg ha–1 yr–1) | Basic wood density (kg m–3) |
| Norway spruce | 4–18 | 8–25 | 5–19 | 2–7 | 350 |
| Scots pine | 2–7 | 0–15 | 2–7 | 1–3 | 440 |
| Silver birch | 7–8 | 10–25 | c. 9 | c. 4 | 480 |
| Black alder | 9 | 10 | 10 | 4 | 370 |
| Grey alder | 10–15 | 18 3) | 12–18 | 4–6 | 360 |
| Aspen | 7–10 | n.a. | 3–4 | 380 | |
| Oak | 4–6 | 0–10 | 4–7 | 2–4 | 575 |
| Beech | 6–10 | 6–10 | 7–11 | 4–6 | 580 |
| Poplar | 20–25 2) | n.a. | 20–25 | 8–9 | 345 |
| Hybrid aspen | 16 | 40 | 22 | 8 | 360 |
| Lodgepole pine 1) | 5–7 | 10 | 5–8 | 2–3 | 430 |
| Hybrid larch | 12–13 | 30–60 | 16–21 | 6–9 | 411 |
| Siberian larch 1) | 4–6 | 10 | 4–6 | 3–4 | 600 5) |
| Sitka spruce | 12–18 | 0–40 | 12–24 | 4–9 | 360 |
| Douglas fir | 15–17 | 8 | 16–18 | 7–8 | 450 |
| Grand fir | c. 21 | 0–20 | 21–25 | 7–9 | 350 |
| MAI is the mean annual increment; n.a. is not available. 1) = In the central and northern part of the region; 2) = Result obtained with the OP42 clone; 3) = Estimated in Rytter and Rytter (2016); 4) = Where improved material was not available, the figures were based on the productivity in natural stands; 5) = Density based on volume of 5% moisture content, and thus resulting in an overestimation of the productivity in terms of mass. | |||||
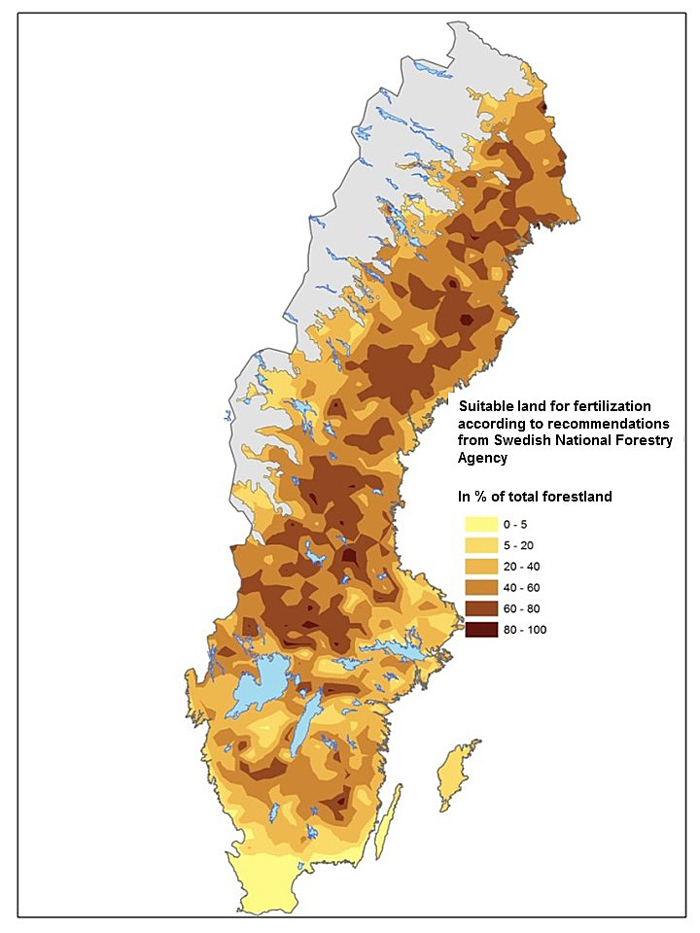
Fig. 1. Forest land suitable for fertilization according to guidelines (30§ SVL) by the Swedish Forest Agency. Data from the Swedish forest inventory.
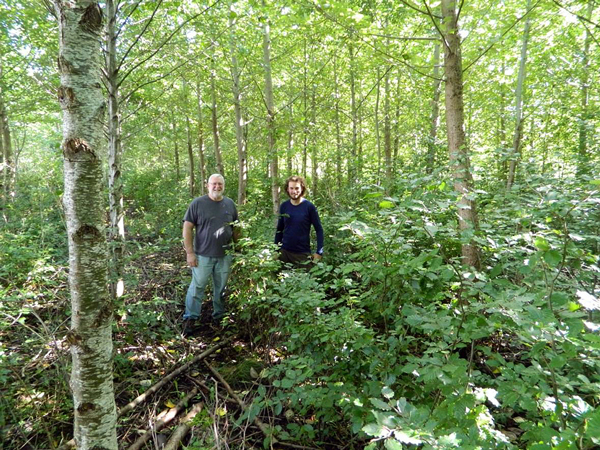
Fig. 2. Two-storied forest structure following afforestation of agricultural land in Denmark. The nurse crop is 11 years old and is a mixture of black alder and hybrid poplar (clone OP42), with directly sown beech below.
Photo: Palle Madsen.
| Table 6. Published information of wood production during coppice in some tree species. Mean production have been calculated using basic density and by including tops and twigs, and formulas for energy in wood (Ebenhard et al. 2013). Year is the rotation period; S = Southern; C = Central; N = Northern. | |||||||
| Tree species | Year | Mean production (tons dry mass ha–1 yr–1) | Mean production (MWh ha–1 yr–1) | Site | Soil type | Comments | Reference |
| Willow | 4 | 10 | 49 | S. Sweden | Agricultural | Often fertilized | Mola-Yudego and Aronsson 2008 |
| Hybrid aspen | 2 | 10 | 47 | S. Sweden | Agricultural | Rytter 2006 | |
| 12 | 10 | 47 | S. Sweden | Agricultural | Mc Carthy and Rytter 2015 | ||
| Aspen | 5 | 4 | 18 | S. Germany | Agricultural | Liesebach et al. 1999 | |
| 35 | 5 | 26 | Finland | Rich soil | Vuokila 1977 | ||
| Black alder | 2 | 3–10 | 17–49 | Kansas, USA | Agricultural | Geyer 2006 | |
| 5 | 13 | 62 | Kentucky, USA | Fine texture | Wittwer and Stringer 1985 | ||
| 20 | 2 | 10 | England | Moist soil | With standards | Harmer 2003 | |
| Grey alder | 3 | 4–5 | 18–23 | C. Sweden | Forest soil | Rytter et al. 2000 | |
| 8 | 5 | 25 | Finland | Forest soil | Saarsalmi et al. 1991 | ||
| 15 | 5.5 | 29 | N. Europe | Various soils | Rytter and Rytter 2016 | ||
| Silver birch | 8 | 3 | 13 | C. Finland | Peat | Hytönen and Issakainen 2001 | |
| 16 | 2 | 10 | N. Finland | Peat | Hytönen and Issakainen 2001 | ||
| Downy birch | 21 | 3 | 21 | S. Finland | Peat | Downy and Silver birch | Hytönen and Aro 2012 |
| 31 | 3 | 16 | England | Dry soil | With standards | Begley and Coates 1961 | |
| Ash | 32 | 2 | 10 | England | Loamy clay | With standards | Harmer 2003 |
| Oak | 37 | 3 | 13 | England | Forest soil | With standards | Harmer 2003 |
| 20–45 | 6–3 | 30–13 | England & Wales | - | - | Crockford and Savill 1991 | |
| Lime | 12 | 2 | 9 | England | Clay soil | With standards | Harmer 2003 |