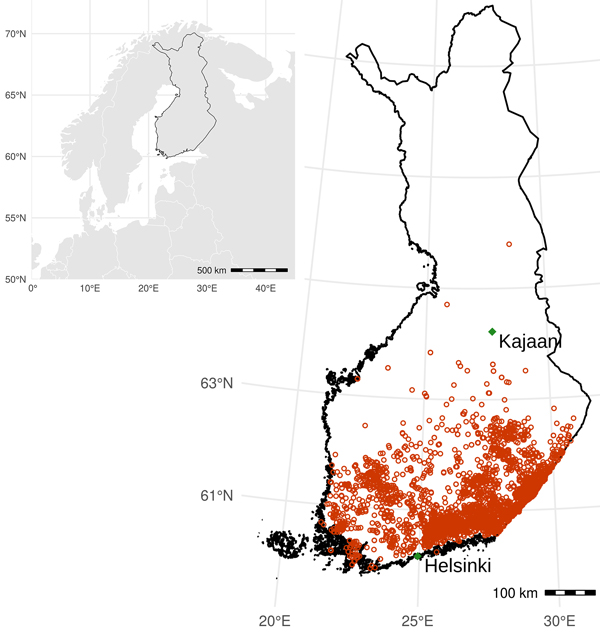
Fig. 1. Study area: Southern half of Finland from 60°N–64°N, and distribution of salvage logging operations due to Ips typographus damage (red circles) during 2012–2020, according to forest-use declaration data.
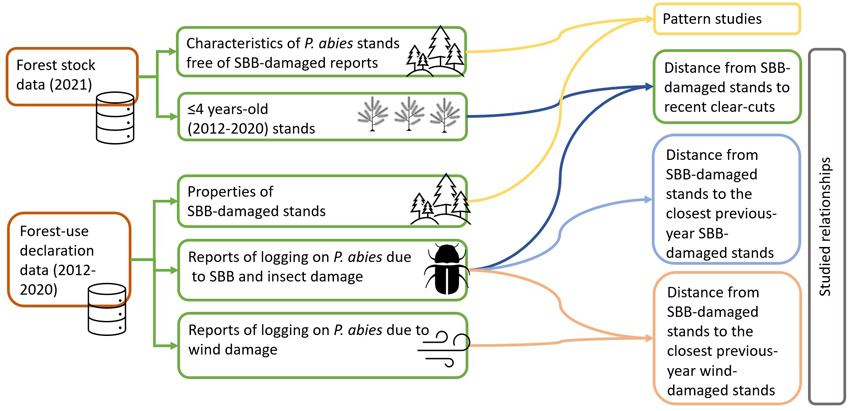
Fig. 2. Methodological workflow for studying the relationship between forest stand and landscape attributes and Ips typographus (SBB) damage on Picea abies stands in Finland (stands ≤4 years old were used as a proxy for recent clear-cuts).
| Table 1. Stand and landscape attributes studied with relation to Ips typographus (SBB) damage in Finland. The presented variables were in both datasets.* | ||
| Category | Attributes | Description |
| Stand | Site fertility class | In decreasing order of fertility: • Herb-rich forest (most fertile, high water holding capacity) • Herb-rich heath forest • Mesic heath forest • Sub-xeric heath forest • Xeric heath forest (barren, low fertility, low water holding capacity) |
| Stand development class | • Young stand: height <7 m, overstory of seed or shade trees • Developing stand: height >7 m, age >11 years, Dmean = 8–16 cm • Developed stand: age >25 years, Dmean >16 cm. • Mature stand: mature enough for regenerative cutting • Shelter-tree stand: natural spruce regeneration protected by a cover of trees | |
| Soil type | • Coarse deposited soil • Coarse moraine soil • Fine-grained deposited soil • Fine-grained heath forest soil • Moraine soil and fine-grained particles • Mull soil • Outcrop stone field • Peat soil • Sedge peat • Semi-coarse or coarse heath forest soil • Sphagnum peat sensitive to erosion • Stony coarse moraine • Stony fine-grained heath forest soil • Stony semi-coarse or coarse heath forest soil | |
| Mean diameter at breast-height | Dmean for each analysed stand (cm) | |
| Mean age | Mean age for each analysed stand (years) | |
| Landscape | Distance to the closest recent clear-cut | Recent clear-cut stands (or stands 0–4 years old) were selected from the forest stock dataset, using the date of the last updated age for the analysed years (2012–2020) |
| Distance to the closest previous-year SBB-damaged stand (SBBDy–1) | Selected from the forest-use declaration dataset in relation to the year of occurrence of the current SBBD. | |
| Distance to the closest previous-year wind-damaged stand (WDy–1) | Selected from the forest-use declaration dataset in relation to the year of occurrence of the current SBBD. | |
| * A complete list of the soil types, site fertility and stand development classes present in Finland is available in Äijälä et al. (2019). Dmean = stand mean diameter at breast height. SBBD = SBB-damaged stand. | ||
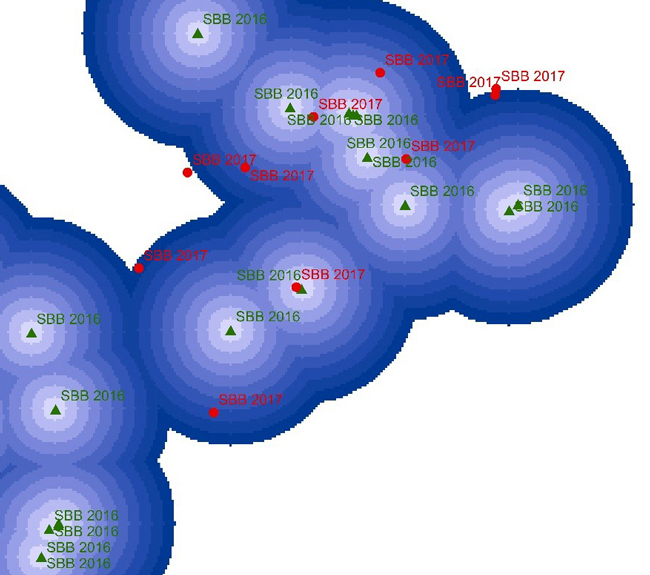
Fig. 3. Illustration on the measurement of the distance from the centroid of each Ips typographus-damaged stand (SBBD; in red) to the closest previous-year SBBD (SBBDy–1; in green). The distance buffers (concentric circles) in 0–1500 m range and 100 m cell size are drawn around the centroid point of SBBD2016 (in green) and centroid points of SBBD2017 (in red) stands. The distance from SBBD2017 to SBBD2016 was measured based on the cell where SBBD2017 occurred. The measurement of distance for the other two landscape attributes (clear-cuts and previous-year wind-damaged stands [WDy–1]) followed the same procedure.
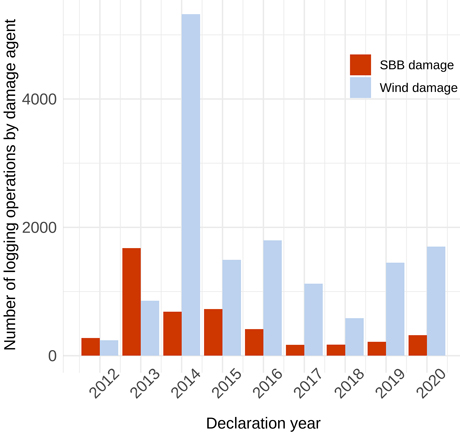
Fig. 4. Number of reported logging operations on Picea abies stands due to Ips typographus (SBB) and wind damage, across Finland during 2012–2020.
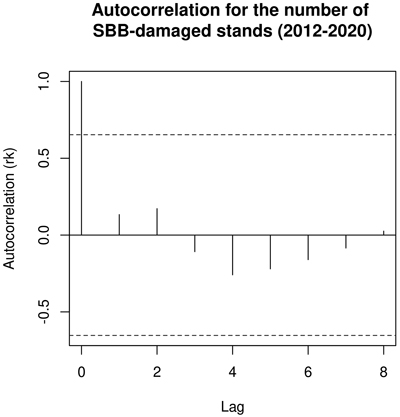
Fig. 5. Correlogram for the number of logging operations due to Ips typographus damage in Finland during 2012–2020.
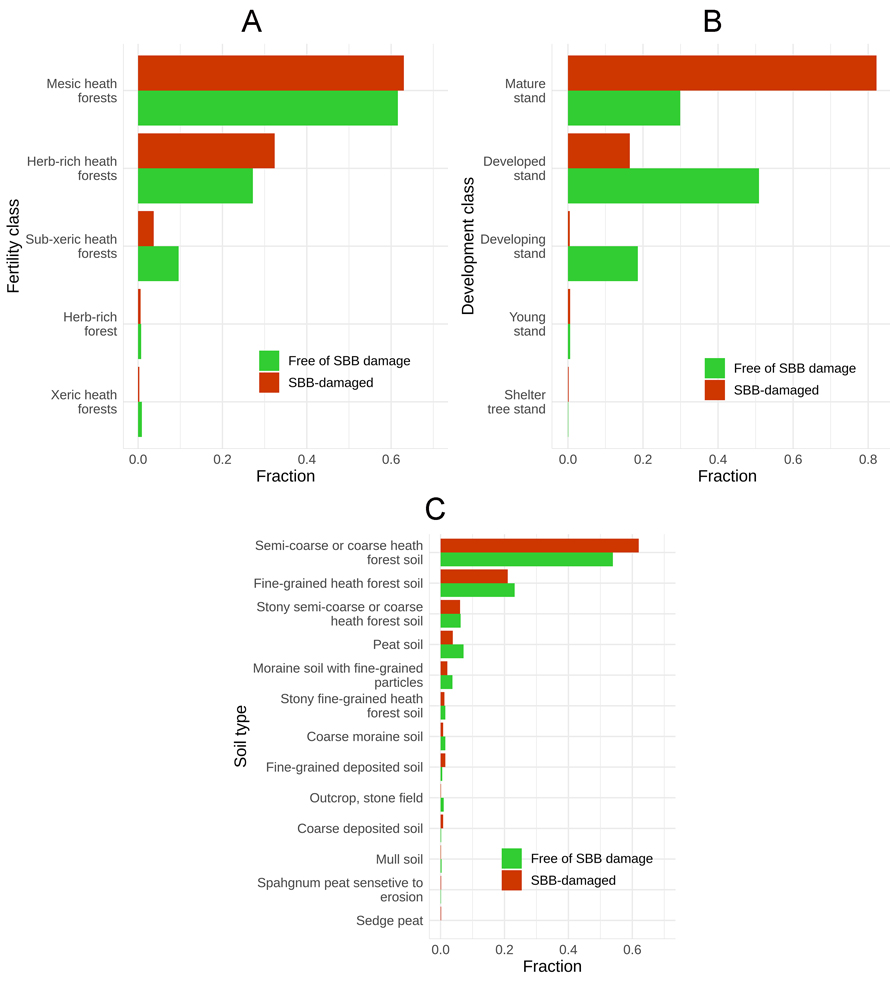
Fig. 6. Distribution of Picea abies stands damaged by Ips typographus (SBB) and free of SBB in Finland during 2012–2020, by (A) site fertility class, (B) stand development class and (C) soil type. See Supplementary file S1 for details.
| Table 2. Statistical results comparing Picea abies stands damaged by Ips typographus (SBB) and stands free of SBB-damage in Finland during 2012–2020, based on Chi-squared (X2; α = 0.05) and Mann-Whitney U tests (U; α = 0.05). | |||||
| Attributes | Statistic value | df * | Number of stands | p-value | |
| SBB-damaged | Non SBB-damaged | ||||
| Site fertility class | X2 = 109.6 | 4 | 4650 | 2 994 536 | <0.001 |
| Stand development class | X2 = 5661.9 | 4 | 4265 | 2 441 024 | <0.001 |
| Soil type | X2 = 562.7 | 13 | 4518 | 3 106 289 | <0.001 |
| Mean diameter at breast height >15 cm | U = 5 137 488 938 | 3116 | 2 165 405 | <0.001 | |
| Mean age >25 years | U = 5 128 003 | 3202 | 2 431 519 | <0.001 | |
| * df = degrees of freedom. | |||||
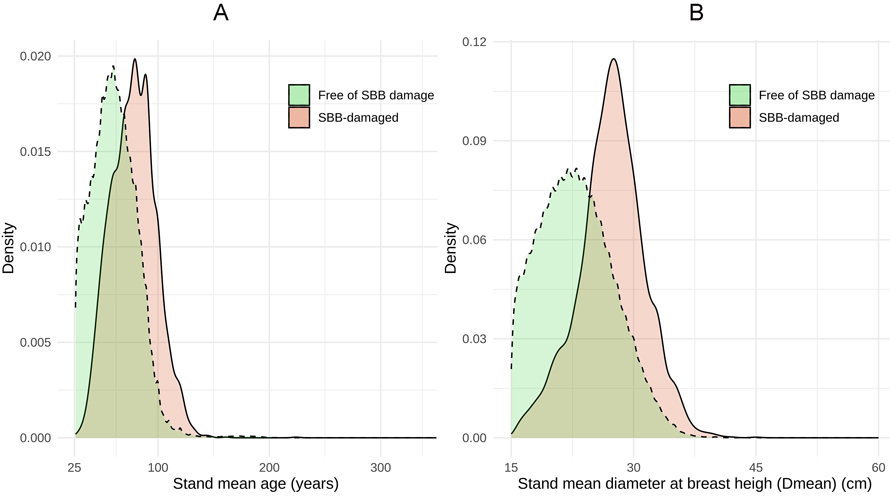
Fig. 7. Density distribution of Picea abies stands damaged by Ips typographus (SBB) and free of SBBD damage in Finland during 2012–2020, in terms of (A) mean age (>25 years) and (B) mean diameter at breast height (Dmean >15 cm) of the stand.
| Table 3. Analysis of deviance (Type III Wald Chi-square tests) of the effects of landscape attributes on the number of Ips typographus-damaged stands (SBBD) in Finland. See methods for model details. | |||
| Variable | Chisq | Df | Pr(>Chisq) |
| Intercept | 57.423 | 1 | <0.001 |
| Distance class | 301.784 | 14 | <0.001 |
| Landscape attribute | 59.566 | 2 | <0.001 |
| Landscape attribute × Distance class | 68.783 | 28 | <0.001 |
| Table 4. Dispersion model for the generalised linear mixed model with a negative binomial probability distribution for the response variable. See methods for model details. | ||||
| Predictor* | Estimate | Std. Error | z-value | Pr(>|z|) |
| Intercept | 6.156 | 2.545 | 2.418 | 0.016 |
| Landscape attribute SBBy–1 | –5.131 | 2.570 | –1.996 | 0.046 |
| Landscape attribute WDy–1 | –6.193 | 2.560 | –2.419 | 0.016 |
| * The landscape attribute clear-cut was the reference category. It is redundant, as it is a linear combination of the remaining parameters. | ||||
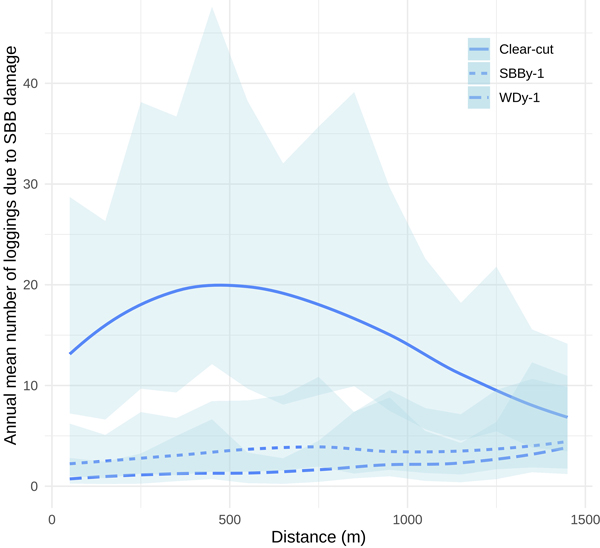
Fig. 8. Effect of distance from clear-cuts, previous-year Ips typographus damage (SBBy–1) and previous-year wind damage (WDy–1) on the mean number of SBB-damaged stands based on the generalised linear mixed model developed in this study. The shaded area represents the 95% Wald-type confidence intervals for the predicted average count.