| Table 1. Geographic and climatic information on the sampling stands in the present study. | |||||||||
| Provenance | Town | Latitude, Longitude | Above sea level (m) | Annual temperature (°C) | Annual precipitation (mm year–1) | ||||
| Mean | Min. (Jan.) | Max. (Jul.) | Mean integrated value | Min. | Max. | ||||
| Khentii | Batshireet | 48°51´N, 110°05´E | 1214 | –1.6 | –27.2 | 19.2 | 368 | 0 (Jan.) | 160 (Jul.) |
| Arkhangai | Tsenker | 47°22´N, 101°43´E | 1707 | 0.5 | –19.9 | 17.4 | 377 | 0 (Jan.) | 150 (Aug.) |
| Zavkhan | Tosontsengel | 48°41´N, 98°17´E | 1878 | –5.0 | –36.1 | 17.7 | 242 | 1 (Feb.) | 92 (Aug.) |
| Khuvsgul | Jargalant | 48°31´N, 99°15´E | 1827 | –1.8 | –29.1 | 18.3 | 226 | 0 (Feb.) | 141 (Aug.) |
| Selenge | Mandal | 48°41´N, 106°52´E | 1120 | 0.2 | –27.2 | 22.4 | 271 | 0 (Mar.) | 157 (Aug.) |
| Min., minimum; Max., maximum. Data on annual temperature and precipitation were provided from Information and Research Institute of Meteorology, Hydrology and Environment, Mongolia. Mean annual temperature was calculated by averaging monthly temperature obtained from 2012 to 2016. Mean integrated values of precipitation were calculated by integrating monthly precipitation values of one year (2012 to 2016), and then averaged integrated values of five years. | |||||||||
| Table 2. Growth characteristics and stress-wave velocity of stems in Larix sibirica trees. | |||||||
| Provenance | n | D (cm) | TH (m) | SWV (km s–1) | |||
| Mean | SD | Mean | SD | Mean | SD | ||
| Khentii | 50 | 24.8 | 2.2 | 19.7 | 1.1 | 3.20 | 0.31 |
| Arkhangai | 50 | 26.5 | 2.5 | 12.2 | 1.5 | 2.92 | 0.19 |
| Zavkhan | 50 | 23.3 | 2.2 | 15.9 | 1.9 | 3.27 | 0.33 |
| Khuvsgul | 50 | 22.7 | 1.9 | 15.1 | 1.7 | 3.34 | 0.32 |
| Selenge | 50 | 22.6 | 2.0 | 16.2 | 1.8 | 3.41 | 0.40 |
| Mean/total | 250 | 24.0 | 1.7 | 15.8 | 2.7 | 3.23 | 0.19 |
| F-value | - | 136.307 | 18.210 | ||||
| p-value | <0.01 | <0.01 | |||||
| n, number of standing trees; D, stem diameter at 1.3 m above ground level; TH, tree height; SWV, stress-wave velocity of stems; SD, standard deviation. F and p-values were obtained by analysis of variance (ANOVA) test. | |||||||
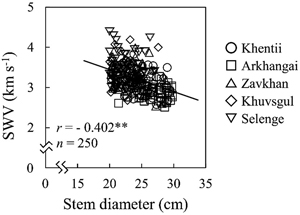
Fig. 1. Relationship between stem diameter at 1.3 m above ground level and stress-wave velocity (SWV) of stems in all standing trees. n, number of trees; r, correlation coefficient; **, p < 0.01.
| Table 3. Dynamic Young’s modulus (GPa) of logs in three height positions of Larix sibirica trees. | ||||||||
| Provenance | Height position (m) | Total | ||||||
| 1.3–3.3 | 3.3–5.3 | 5.3–7.3 | ||||||
| Mean | SD | Mean | SD | Mean | SD | Mean | SD | |
| Khentii | 8.39 | 1.50 | 8.48 | 0.93 | 8.11 | 0.83 | 8.32 | 0.19 |
| Arkhangai | 5.75 | 0.75 | 5.32 | 0.92 | 4.43 | 0.41 | 5.17 | 0.67 |
| Zavkhan | 7.54 | 1.74 | 7.52 | 1.94 | 6.99 | 2.14 | 7.35 | 0.31 |
| Khuvsgul | 7.54 | 0.49 | 7.11 | 0.65 | 7.18 | 0.17 | 7.28 | 0.23 |
| Selenge | 9.75 | 0.52 | 10.16 | 0.88 | 10.00 | 1.40 | 9.97 | 0.20 |
| Mean/total | 7.79 | 1.46 | 7.72 | 1.78 | 7.34 | 2.02 | 7.62 | 1.75 |
| F-value | 8.359 | 11.851 | 13.606 | 36.118 | ||||
| p-value | <0.01 | <0.01 | <0.01 | <0.01 | ||||
| SD, standard deviation. F and p-values were obtained by analysis of variance (ANOVA) test. Number of logs at each height position of a stand was 5. Mean value of total in each stand was calculated by averaging the values of 15 trees harvested from a stand. | ||||||||
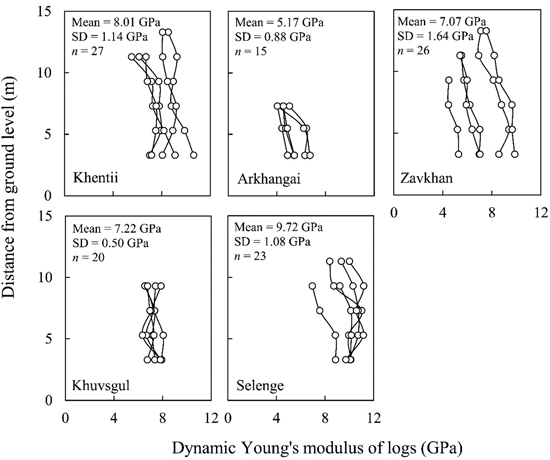
Fig. 2. Longitudinal variations of dynamic Young’s modulus of logs in Larix sibirica in each stand. SD, standard deviation; n, number of logs. Open circles indicate the data on the individual logs collected at different height positions of stem from five harvested trees in each stand. Mean value and standard deviation of all logs (n = 111) were 7.44 and 1.64 GPa, respectively.
| Table 4. Growth characteristics, stress-wave velocity of stems, and wood properties in harvested Larix sibirica trees. | |||||||||||||||||
| Provenance | n | D (cm) | TH (m) | SWV (km s–1) | DMOES (GPa) | NAR | ARW (mm) | LWP (%) | BD (g cm–3) | ||||||||
| Mean | SD | Mean | SD | Mean | SD | Mean | SD | Mean | SD | Mean | SD | Mean | SD | Mean | SD | ||
| Khentii | 5 | 25.2 | 0.3 | 19.5 | 1.4 | 3.05 | 0.12 | 6.80 | 0.82 | 72 | 5 | 1.55 | 0.08 | 32.2 | 3.3 | 0.56 | 0.05 |
| Arkhangai | 5 | 26.6 | 0.2 | 11.6 | 1.2 | 2.87 | 0.12 | 6.72 | 0.62 | 44 | 4 | 2.47 | 0.56 | 22.2 | 3.1 | 0.53 | 0.01 |
| Zavkhan | 5 | 23.6 | 0.2 | 15.9 | 1.0 | 3.27 | 0.29 | 7.84 | 1.78 | 193 | 6 | 0.49 | 0.05 | 33.2 | 3.5 | 0.55 | 0.03 |
| Khuvsgul | 5 | 22.5 | 0.3 | 15.1 | 0.7 | 3.24 | 0.14 | 8.41 | 0.67 | 49 | 5 | 1.86 | 0.20 | 26.4 | 2.7 | 0.52 | 0.02 |
| Selenge | 5 | 22.5 | 0.2 | 17.3 | 2.7 | 3.55 | 0.26 | 10.14 | 1.85 | 52 | 8 | 1.74 | 0.23 | 31.0 | 3.6 | 0.54 | 0.02 |
| Mean/Total | 25 | 24.1 | 1.8 | 15.9 | 2.9 | 3.20 | 0.26 | 7.98 | 1.40 | 1.62 | 0.72 | 29.0 | 4.6 | 0.53 | 0.02 | ||
| F-value | - | 16.978 | 7.958 | 6.065 | - | 31.579 | 9.737 | 1.360 | |||||||||
| p-value | <0.01 | <0.01 | <0.01 | <0.01 | <0.01 | 0.282 | |||||||||||
| n, number of harvested trees; D, stem diameter at 1.3 m above ground; TH, tree height; SWV, stress-wave velocity of stem; DMOES, dynamic Youngs modulus of stem; NAR, number of annual ring; ARW, annual ring width; LWP, latewood percentage; BD, basic density; SD, standard deviation. F and p-values were obtained by analysis of variance (ANOVA) test. | |||||||||||||||||
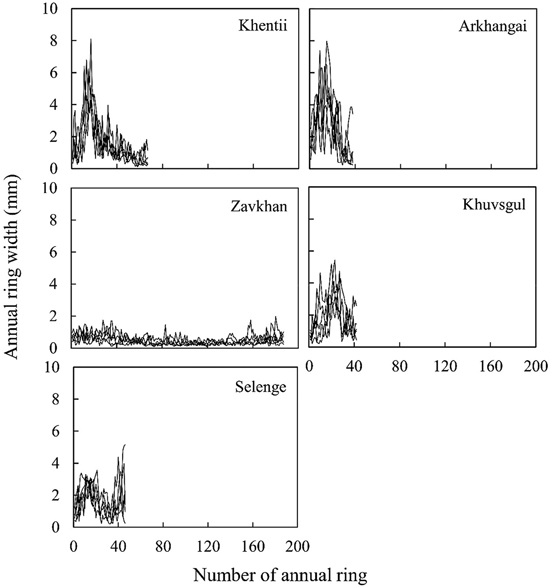
Fig. 3. Radial variations of annual ring width for five sample trees in each stand.
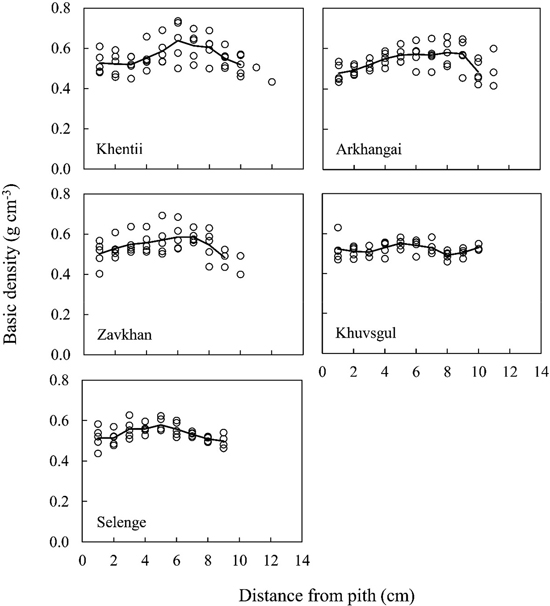
Fig. 4. Radial variations of basic density for five sample trees in each stand. Open circles indicate the data on the individual trees at 1.3 m above ground level. Solid lines indicate mean values of five trees.
| Table 5. Relationships between stem diameter and mean annual ring width between certain radial positions. | ||
| Factor 1 | Factor 2 | r (n = 25) |
| D | Mean ARW from 1 to 10 | 0.602** |
| Mean ARW from 1 to 20 | 0.692** | |
| Mean ARW from 1 to 30 | 0.613** | |
| Mean ARW from 1 to 40 | 0.557** | |
| Mean ARW 1–10 | Mean ARW from 11 to 20 | 0.629** |
| Mean ARW from 21 to 30 | 0.137ns | |
| Mean ARW from 31 to 40 | 0.018ns | |
| r, correlation coefficient; n, number of samples; D, stem diameter; ARW, annual ring width; **, p < 0.01; ns, p > 0.05. | ||
| Table 6. Correlation coefficients between wood properties. | ||
| Factor 1 | Factor 2 | r (n = 25) |
| BD | SWV | –0.140ns |
| DMOES | –0.202ns | |
| DMOEL | 0.087ns | |
| ARW | –0.132ns | |
| LWP | 0.447* | |
| SWV | DMOES | 0.953** |
| DMOEL | 0.798** | |
| ARW | –0.223ns | |
| LWP | 0.323ns | |
| DMOES | DMOEL | 0.729** |
| ARW | –0.002ns | |
| LWP | 0.106ns | |
| DMOEL | ARW | –0.148ns |
| LWP | 0.493* | |
| ARW | LWP | –0.681** |
| r, correlation coefficient; n, number of samples; BD, basic density; SWV, stress-wave velocity of stem, DMOES, dynamic Young’s modulus of stem; DMOEL, dynamic Young’s modulus of log; ARW, annual ring width; LWP, latewood percentage; **, p < 0.01; *, p < 0.05; ns, p > 0.05 | ||