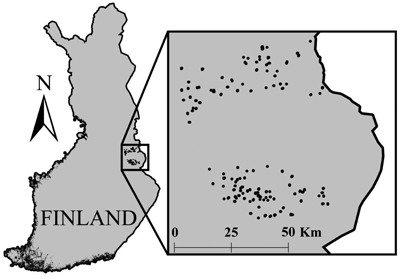
Fig. 1. The location of field sample plot clusters.
| Table 1. The main attributes of the 265 studied field plots. Min = minimum, Max = maximum, Sd = Standard deviation. |
| Attribute | Population | Mean | Min1 | Max | Sd |
| Volume (m3 ha–1) | Total | 124.2 | 1.42 | 403.3 | 78.3 |
| Scots pine | 88.8 | 0.45 | 294.2 | 61.7 |
| Norway spruce | 39.2 | 0.19 | 400.6 | 55.8 |
| Deciduous trees | 17.6 | 0.25 | 167.5 | 23.8 |
| Basal area (m2 ha–1) | Total | 16.8 | 0.43 | 44.6 | 7.9 |
| Scots pine | 11.5 | 0.14 | 33.1 | 6.6 |
| Norway spruce | 5.6 | 0.08 | 39.2 | 6.7 |
| Deciduous trees | 2.8 | 0.08 | 18.7 | 3.2 |
| Mean diameter (cm) | Total | 14.3 | 6.6 | 33.6 | 4.4 |
| Scots pine | 17.6 | 6.1 | 41.6 | 6.9 |
| Norway spruce | 12.1 | 5.0 | 27.9 | 4.8 |
| Deciduous trees | 10.8 | 5.1 | 44.6 | 5.4 |
| Mean height (cm) | Total | 12.0 | 2.7 | 23.9 | 3.4 |
| Scots pine | 13.9 | 5.0 | 28.3 | 4.8 |
| Norway spruce | 9.6 | 3.5 | 21.9 | 3.7 |
| Deciduous trees | 10.6 | 2.7 | 23.6 | 4.0 |
| Number of stems (ha–1) | Total | 1014 | 196 | 2790 | 507 |
| Scots pine | 538 | 39 | 1965 | 362 |
| Norway spruce | 365 | 39 | 2476 | 401 |
| Deciduous trees | 307 | 39 | 2397 | 308 |
| Mean crown base height (dm) | Total | 48.9 | 8.7 | 129.6 | 21.0 |
| Scots pine | 67.3 | 8.8 | 189.3 | 34.1 |
| Norway spruce | 20.1 | 3.0 | 62.6 | 13.5 |
| Deciduous trees | 42.5 | 7.0 | 137.0 | 23.7 |
| Basal-area-weighted mean crown base height (dm) | Total | 58.9 | 8.8 | 155.5 | 25.9 |
| Scots pine | 70.9 | 8.9 | 188.5 | 34.4 |
| Norway spruce | 22.9 | 3.0 | 64.2 | 15.6 |
| Deciduous trees | 46.4 | 7.0 | 142.4 | 26.9 |
| Table 2. The distribution of plots according to categorical stand characteristics. DBH is the arithmetic mean of the DBH at the plot-level. The dominant species was determined as the species with the largest proportion from the sum of tree stem volumes in a plot. |
| Characteristic | Sub class | N | % |
| Soil type | Mineral soil | 201 | 75.8 |
| Peat soil | 64 | 24.2 |
| Site type | Fertile / Oxalis-Myrtillus type (OMT) | 2 | 0.8 |
| Moderate / Vaccinium Myrtillus type (MT) | 181 | 68.3 |
| Poor / Vaccinium vitis-idaea type (VT) | 82 | 30.9 |
| Development class | T2 (DBH < 8 cm) | 8 | 3.0 |
| 02 (8 cm ≤ DBH < 16 cm) | 184 | 69.4 |
| 03 (16 cm ≤ DBH < 24 cm) | 65 | 24.5 |
| 04 (DBH ≥ 24 cm) | 8 | 3.0 |
| Dominant species | Scots pine | 208 | 78.5 |
| Norway spruce | 42 | 15.8 |
| Deciduous trees | 15 | 5.7 |
| Table 3. The ALS metrics used in this study. Suffices single and first refer to using only single or first-of-many echoes, respectively; otherwise, the metrics were computed using pooled single and first-of-many echoes. |
| ALS metric | Definition |
| CBHas | CBH prediction based on alpha shapes (see Section 2.3.3) |
| Hmax | Maximum height |
| Hmean | Mean height |
| Hstd | Standard deviation of height |
| Vegeratio | Ratio of the number of echoes above 2 m to the total number of echoes |
| H05…H95 | ith percentile of height |
| D05…D95 | Relative density at height i |
| Imean | Mean intensity |
| Imeansingle | Mean intensity (single echoes) |
| Imeanfirst | Mean intensity (first-of-many echoes) |
| Istd | Standard deviation of intensity |
| Istdsingle | Standard deviation of intensity (single echoes) |
| Istdfirst | Standard deviation of intensity (first-of-many echoes) |
| Prop_first | Proportion of first-of-many echoes |
| Table 4. Features selected for the tree list imputations. The RMSEs refers to those of basal-area weighted plot-level mean CBHs and the Impr. columns give the improvement in RMSE (%) compared to the previous step. |
| Step | X-feature(s) | Y-feature(s) RMSE | RMSE |
| k = 1 | Impr. | k = 5 | Impr. |
| 1 | All | Heightmin | 3.11 | - | 2.77 | - |
| All | Heightmin + Height70 | 1.59 | 49.04 | 1.42 | 48.58 |
| All | Heightmin + Height70 + Diameter80 | 1.54 | 2.59 | 1.36 | 4.24 |
| 2 | Hmean | Heightmin + Height70 + Diameter80 | 1.47 | 4.95 | 1.34 | 1.49 |
| Hmean + D90 | Heightmin + Height70 + Diameter80 | 1.30 | 11.19 | 1.23 | 7.97 |
| Hmean + D90 + H10 | Heightmin + Height70 + Diameter80 | 1.30 | 0.57 | 1.23 | 0.38 |
| Table 5. The RMSEs and biases obtained with different methods when predicting the plot-level arithmetic mean crown base height (CBHARI) or basal-area-weighted mean crown base height (CBHBAW) for the whole study data. |
| CBHARI | PMk-NN | LME-model | α-shape | LR-model |
| RMSE (dm) | 12.65 | 15.61 | 16.42 | 11.29 |
| %-RMSE | 25.89 | 31.95 | 33.59 | 23.10 |
| BIAS (dm) | –0.64 | –8.43 | –9.67 | –0.01 |
| %-BIAS | –1.30 | –17.25 | –19.79 | –0.02 |
| CBHBAW | | | | |
| RMSE (dm) | 14.47 | 17.42 | 15.16 | 12.29 |
| %-RMSE | 24.59 | 29.60 | 25.76 | 20.89 |
| BIAS (dm) | 1.05 | –8.91 | 0.31 | 0.02 |
| %-BIAS | 1.78 | –15.13 | 0.53 | 0.03 |
| Table 6. The RMSEs and biases obtained with different methods when predicting the plot-level arithmetic mean CBH for the plots dominated by different species or mixed plots. |
| Scots pine (n = 201) | PMk-NN | LME-model | α-shape | LR-model |
| RMSE (dm) | 12.71 | 14.00 | 15.55 | 11.14 |
| %-RMSE | 24.68 | 27.19 | 30.21 | 21.63 |
| BIAS (dm) | 1.10 | –6.25 | –8.50 | 0.79 |
| %-BIAS | 2.14 | –12.14 | –16.52 | 1.53 |
| Norway spruce (n = 38) | | | | |
| RMSE (dm) | 9.32 | 17.48 | 14.11 | 7.97 |
| %-RMSE | 20.86 | 39.12 | 31.57 | 17.83 |
| BIAS (dm) | –2.71 | –13.93 | –9.66 | 0.19 |
| %-BIAS | –6.07 | –31.17 | –21.62 | 0.42 |
| Deciduous species (n = 15) | | | | |
| RMSE (dm) | 18.93 | 27.63 | 29.21 | 16.88 |
| %-RMSE | 55.66 | 81.24 | 85.90 | 49.64 |
| BIAS (dm) | –13.68 | –20.46 | –22.46 | –8.34 |
| %-BIAS | –40.23 | –60.15 | –66.03 | –24.55 |
| Mixed (n = 11) | | | | |
| RMSE (dm) | 10.88 | 13.98 | 14.81 | 7.60 |
| %-RMSE | 30.50 | 39.19 | 41.51 | 21.29 |
| BIAS (dm) | –7.41 | –12.76 | –13.58 | –3.67 |
| %-BIAS | –20.78 | –35.75 | –38.08 | –10.30 |
| Table 7. The RMSEs and biases obtained with different methods when predicting the plot-level basal-area-weighted mean CBH for the plots dominated by different species or mixed plots . |
| Scots pine (n = 201) | PMk-NN | LME-model | α-shape | LR-model |
| RMSE (dm) | 13.88 | 12.81 | 14.72 | 11.54 |
| %-RMSE | 22.31 | 20.58 | 23.66 | 18.54 |
| BIAS (dm) | 4.34 | –4.58 | 2.24 | 2.20 |
| %-BIAS | 6.97 | –7.36 | 3.60 | 3.53 |
| Norway spruce (n = 38) | | | | |
| RMSE (dm) | 14.04 | 26.33 | 13.38 | 11.63 |
| %-RMSE | 26.04 | 48.84 | 24.82 | 21.57 |
| BIAS (dm) | –6.80 | –22.86 | –0.45 | –5.94 |
| %-BIAS | –12.61 | –42.39 | –0.83 | –11.02 |
| Deciduous species (n = 15) | | | | |
| RMSE (dm) | 21.28 | 33.07 | 24.12 | 21.04 |
| %-RMSE | 55.80 | 86.74 | 63.26 | 55.19 |
| BIAS (dm) | –14.95 | –24.82 | –18.34 | –9.66 |
| %-BIAS | –39.20 | –65.11 | –48.12 | –25.33 |
| Mixed (n = 11) | | | | |
| RMSE (dm) | 14.99 | 20.67 | 12.73 | 11.72 |
| %-RMSE | 35.27 | 48.67 | 29.98 | 27.59 |
| BIAS (dm) | –10.15 | –18.07 | –6.79 | –5.95 |
| %-BIAS | –23.89 | –42.54 | –15.98 | –14.02 |
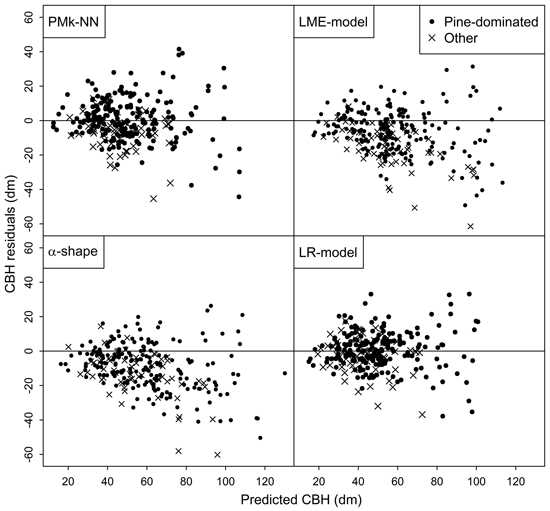
Fig. 2. Residuals of the different methods in the prediction of arithmetic mean CBH.
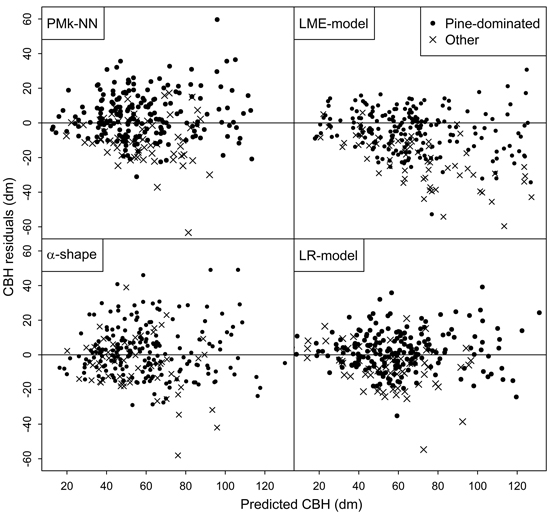
Fig. 3. Residuals of the different methods in the prediction of basal-area-weighted mean CBH.