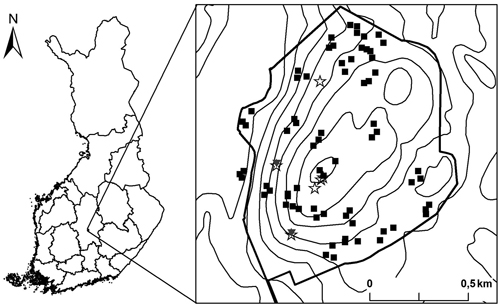
Fig. 1. Location of the study site in Central Finland and the locations of the study plots. Thick line represents the protected area border and thin lines altitude contours. The plots in the set-up A are marked with black squares, B with grey triangles and C with stars (see methods for the detailed description of the different data collection set ups). The three plots located outside the protected area are situated on a structurally similar forest adjoining the protected area.
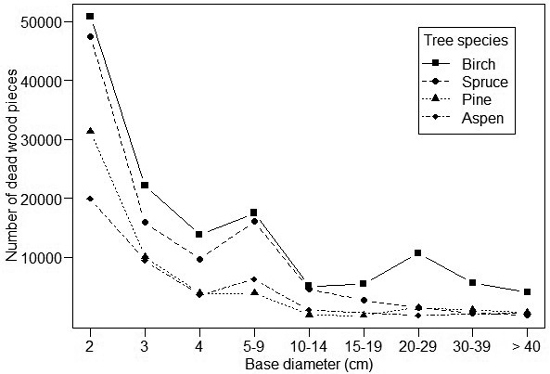
Fig. 2. The size-abundance distribution of dead wood items of different tree species. Note that size below 2 cm is not indicated due to their high number: ca. 150 million for spruce, 37 million for birch, 9 million for pine and 0.5 million for aspen.
| Table 1. The estimated mean volume (with standard error) of dead wood (m3/hectare), the total and mean number (with standard error) of dead wood items in the study plots, and the number of plots particular dead wood type was encountered. Values are given separately for the two size classes (2–9 cm and ≥10 cm). View in new window/tab. |
| Table 2. The dead wood profile for Betula spp., Picea abies, Pinus sylvestris and Populus tremula, where the mean volume per hectare (m3 ha–1) is divided among the five size classes and decay stages. | |||||
| Betula | 2–9 cm | 10–19 cm | 20–29 cm | 30–39 cm | >40 cm |
| Decay stage 1 | 0.21 | 0.16 | 1.60 | 2.20 | 1.62 |
| 2 | 0.28 | 0.41 | 2.24 | 5.53 | 3.80 |
| 3 | 0.17 | 0.80 | 3.12 | 2.00 | 13.30 |
| 4 | 0.21 | 0.93 | 5.29 | 2.27 | 3.71 |
| 5 | 0.03 | 0.70 | 1.74 | 1.41 | 1.16 |
| Picea | 2–9 cm | 10–19 cm | 20–29 cm | 30–39 cm | >40 cm |
| Decay stage 1 | 0.62 | 1.76 | 2.04 | ||
| 2 | 0.31 | 0.46 | 1.31 | 0.72 | |
| 3 | 0.10 | 0.11 | 0.25 | 0.75 | |
| 4 | 0.04 | 0.47 | 0.02 | 0.16 | |
| 5 | 0.02 | 0.03 | 0.10 | ||
| Pinus | 2–9 cm | 10–19 cm | 20–29 cm | 30–39 cm | >40 cm |
| Decay stage 1 | 0.06 | 1.15 | 0.89 | ||
| 2 | 0.07 | 0.05 | 0.66 | 1.21 | 2.50 |
| 3 | 0.02 | 0.01 | 0.59 | 1.24 | |
| 4 | 0.01 | 0.29 | 0.06 | 0.22 | 0.26 |
| 5 | 0.02 | ||||
| Populus | 2–9 cm | 10–19 cm | 20–29 cm | 30–39 cm | >40 cm |
| Decay stage 1 | 0.08 | 0.72 | 0.01 | ||
| 2 | 0.20 | 0.17 | 10.52 | ||
| 3 | 0.06 | 0.04 | |||
| 4 | 0.01 | 0.02 | |||
| 5 | 0.01 | 0.13 | |||
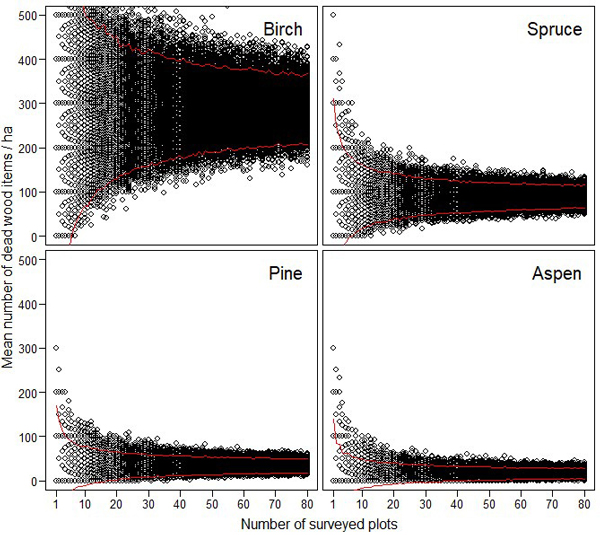
Fig. 3. The effect of sampling effort (i.e. the number of 10 m × 10 m plots) on the reliability of the estimated amount of coarse woody debris for birch, spruce, pine and aspen. The maximum estimates (= 1600) for birch is not shown to enable better comparison between the different tree species. The red lines indicate 95% confidence intervals.
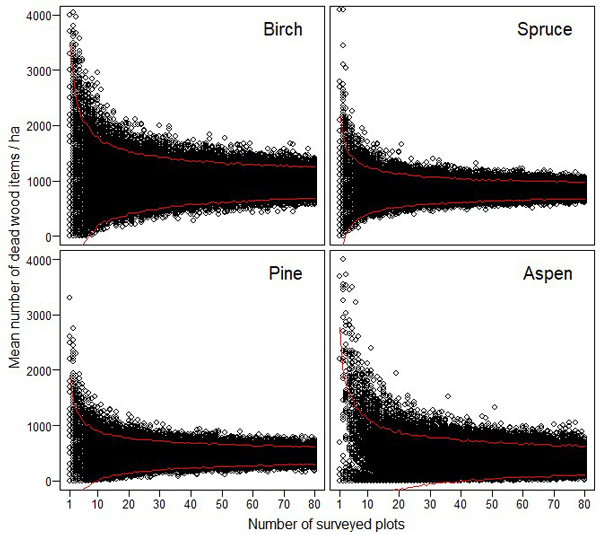
Fig. 4. The effect of sampling effort (i.e. the number of 10 m × 10 m plots) on the reliability of the estimated amount of fine woody debris for birch, spruce, pine and aspen. The maximum estimates for birch (= 5600), and for aspen (= 6900) are not shown to enable better comparison between the different tree species. The red lines indicate 95% confidence intervals.