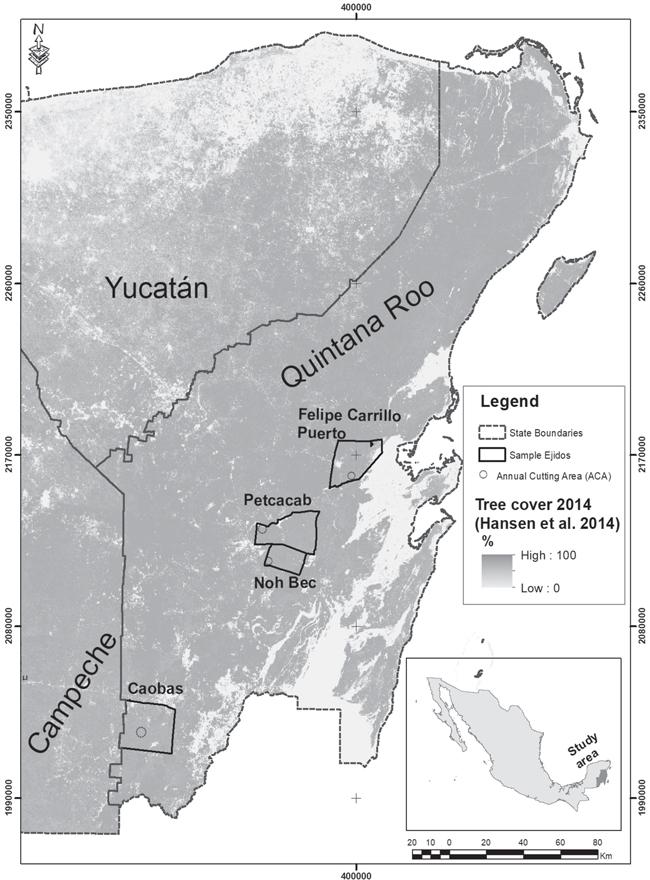
Fig. 1. Location of study area and sampled forestry ejidos in Quintana Roo, Mexico.
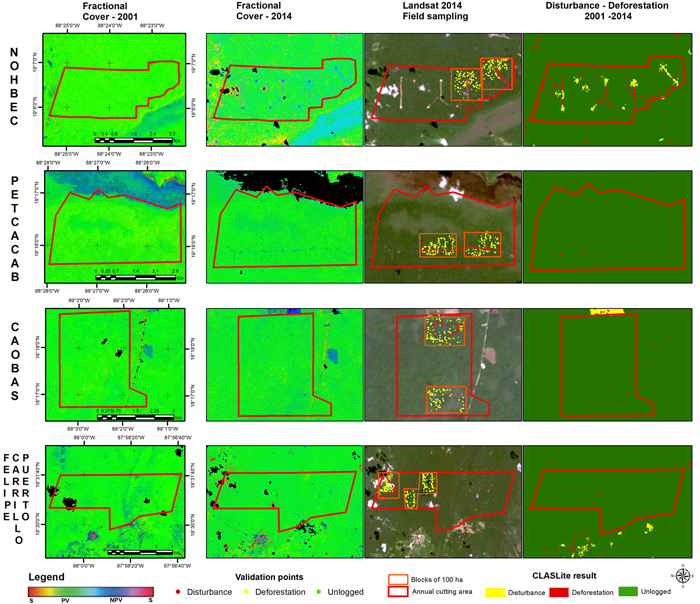
Fig. 2. Images used and results of the analysis using the CLASlite 3.3 software. View larger in new window/tab.
| Table 1. Adjusted confusion matrices of CLASlite 3.3 results for each ejido ACA. | |||||||||||||
| Caobas | Petcacab | Felipe Carrillo Puerto | Noh Bec | ||||||||||
| Observed | |||||||||||||
| Predicted | Dist | Def | Unlog | Dist | Def | Unlog | Dist | Def | Unlog | Dist | Def | Unlog | |
| Dist | 0.00 | 0.00 | 0.00 | 0.00 | 0.00 | 0.00 | 0.00 | 0.00 | 0.00 | 0.01 | 0.02 | 0.00 | |
| Def | 0.00 | 0.00 | 0.00 | 0.00 | 0.00 | 0.00 | 0.00 | 0.00 | 0.00 | 0.01 | 0.02 | 0.00 | |
| Unlog | 0.69 | 0.17 | 0.14 | 0.68 | 0.18 | 0.14 | 0.70 | 0.16 | 0.14 | 0.75 | 0.03 | 0.16 | |
| Def = Deforestation; Dist = Degradation; Unlog = Unlogged | |||||||||||||