| Table 1. Mean ± SD of cavity density, density of trees with cavity and the number of cavities per tree in different habitat types in a seasonal rainforest in tropical China. Significant differences within columns (Kruskal-Wallis ANOVA with post-hoc Dunn-Bonferroni test) are character coded. | |||
| Habitat type | Cavity density (cavities per hectare) | Density of trees with cavity (trees per hectare) | No. of cavities (cavities/tree) |
| Valley | 102.3 ± 76.4 ab | 80.9 ± 53.9 bc | 0.086 ± 0.065 a |
| Low-slope | 118.1 ± 76.1 a | 95.3 ± 58.1 ab | 0.091 ± 0.057 a |
| High-slope | 129.2 ± 84.0 a | 101.7 ± 55.1 a | 0.081 ± 0.052 a |
| High-gully | 117.4 ± 87.0 ab | 89.4 ± 61.6 abc | 0.081 ± 0.058 ab |
| High-plateau | 85.3 ± 70.2 b | 70.0 ± 55.4 c | 0.063 ± 0.063 b |
| df | 4 | 4 | 4 |
| Statistic | H = 220.420 | H = 22.538 | H = 18.022 |
| P | <0.001 | <0.001 | 0.001 |
| P values <0.05 are shown in bold. | |||
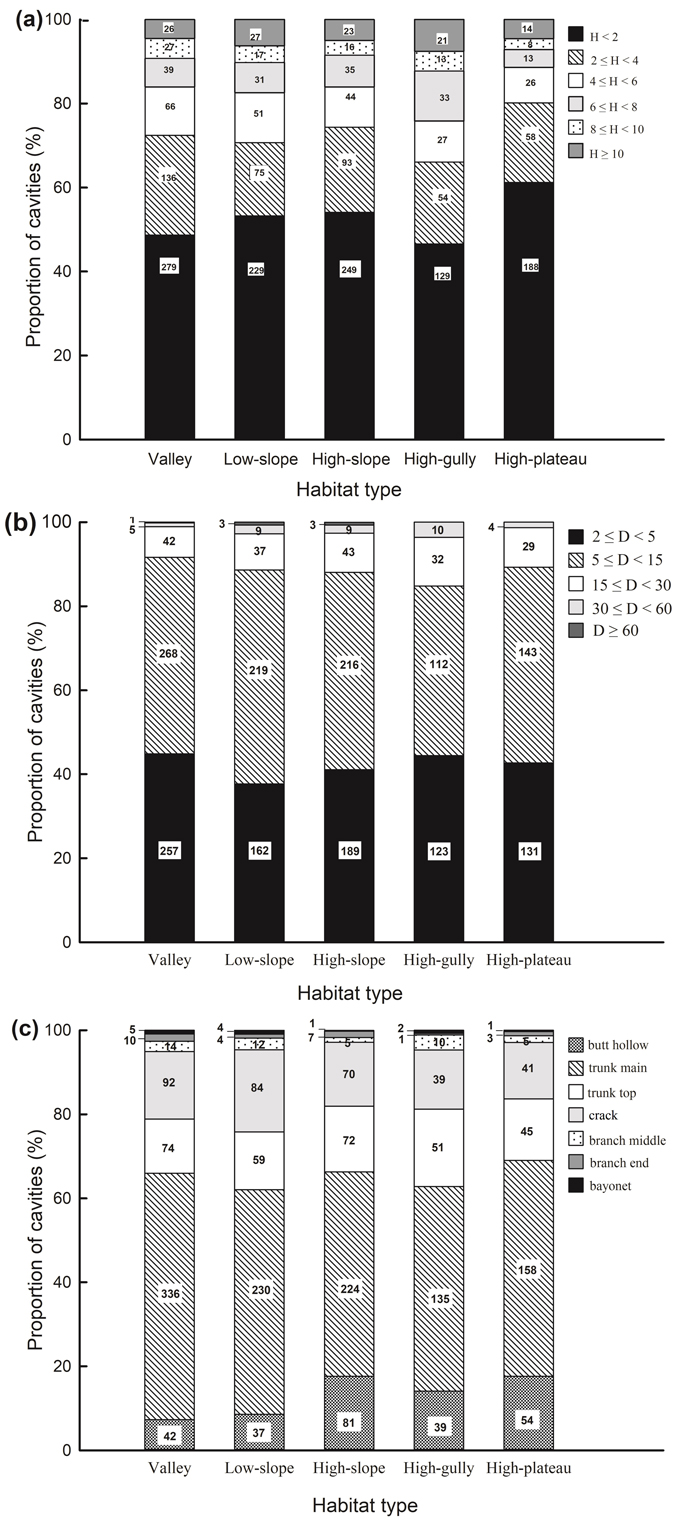
Fig. 1. Proportion of cavities with (a) cavity height above ground, (b) cavity size, (c) cavity type across different habitat types in a seasonal rainforest in tropical China. The number of cavities in each category is shown.
| Table 2. Mean ± SD of cavity density (cavities per hectare) across habitats in a seasonal rainforest in tropical China. Significant differences within rows (Kruskal-Wallis ANOVA with post-hoc Dunn-Bonferroni test) are character coded. | ||||||||
| Variable | Valley | Low-slope | High-slope | High-gully | High-plateau | df | H | P |
| (a): Cavity height | ||||||||
| <2 m | 49.8 ± 49.6 b | 62.9 ± 54.7 ab | 69.9 ± 53.9 a | 54.7 ± 53.2 ab | 52.2 ± 50.6 ab | 4 | 13.841 | 0.008 |
| 2–4 m | 24.3 ± 28.6 ab | 20.6 ± 24.9 ab | 26.1 ± 27.7 a | 22.9 ± 27.2 ab | 16.1 ± 27.4 b | 4 | 10.866 | 0.028 |
| 4–6 m | 11.8 ± 20.4 | 14.0 ± 19.4 | 12.4 ± 22.0 | 11.4 ± 20.4 | 7.2 ± 14.1 | 4 | 6.237 | 0.182 |
| 6–8 m | 7.0 ± 15.3 b | 8.5 ± 17.2 ab | 9.8 ± 17.9 ab | 14.0 ± 20.9 a | 3.6 ± 10.3 b | 4 | 17.605 | 0.001 |
| 8–10 m | 4.8 ± 14.0 | 4.7 ± 13.9 | 4.5 ± 11.7 | 5.5 ± 11.4 | 2.2 ± 7.2 | 4 | 4.016 | 0.404 |
| ≥10 m | 4.6 ± 13.3 | 7.4 ± 17.3 | 6.5 ± 17.1 | 8.9 ± 21.2 | 3.9 ± 13.5 | 4 | 4.745 | 0.314 |
| (b): Cavity size | ||||||||
| 2–5 cm | 45.9 ± 46.7 | 44.5 ± 39.4 | 53.1 ± 44.4 | 52.1 ± 47.9 | 36.4 ± 38.6 | 4 | 8.360 | 0.079 |
| 5–15 cm | 47.9 ± 46.3 ab | 60.2 ± 47.7 a | 60.7 ± 55.4 a | 47.5 ± 51.2 ab | 39.7 ± 42.9 b | 4 | 15.060 | 0.005 |
| 15–30 cm | 7.5 ± 14.6 | 10.2 ± 19.7 | 12.1 ± 22.6 | 13.6 ± 23.8 | 8.1 ± 13.9 | 4 | 3.433 | 0.488 |
| 30–60 cm | 0.9 ± 4.7 b | 2.5 ± 8.4 ab | 2.5 ± 8.5 ab | 4.2 ± 10.5 a | 1.1 ± 6.4 ab | 4 | 11.445 | 0.022 |
| ≥60 cm | 0.2 ± 2.1 | 0.8 ± 4.5 | 0.8 ± 4.5 | 0.0 ± 0.0 | 0.0 ± 0.0 | 4 | 6.970 | 0.138 |
| (c): Cavity type | ||||||||
| butt hollow | 7.5 ± 15.2 b | 10.2 ± 16.7 b | 22.8 ± 30.8 a | 16.5 ± 26.9 ab | 15.0 ± 25.4 ab | 4 | 24.231 | <0.001 |
| trunk main | 60.0 ± 48.5 ab | 63.2 ± 52.5 ab | 62.9 ± 51.1 a | 57.2 ± 45.5 ab | 43.9 ± 44.7 b | 4 | 11.271 | 0.024 |
| trunk top | 13.2 ± 21.3 | 16.2 ± 24.8 | 20.2 ± 23.2 | 21.6 ± 33.3 | 12.5 ± 18.8 | 4 | 9.724 | 0.065 |
| crack | 16.4 ± 25.2 ab | 23.1 ± 26.7 a | 19.7 ± 24.3 ab | 16.5 ± 25.3 ab | 11.4 ± 21.6 b | 4 | 15.341 | 0.004 |
| branch middle | 2.5 ± 8.1 | 3.3 ± 13.0 | 1.4 ± 8.7 | 4.2 ± 11.5 | 1.4 ± 5.8 | 4 | 6.283 | 0.179 |
| branch end | 1.8 ± 7.1 | 1.1 ± 5.2 | 2.0 ± 6.8 | 0.4 ± 3.3 | 0.8 ± 4.5 | 4 | 3.993 | 0.407 |
| bayonet | 0.9 ± 4.7 | 1.1 ± 5.2 | 0.3 ± 2.6 | 0.8 ± 4.6 | 0.3 ± 2.6 | 4 | 3.118 | 0.538 |
| P values <0.05 are shown in bold. | ||||||||
| Table 3. Rayleigh test of orientation of cavities in each habitat in a seasonal rainforest in tropical China. | |||||
| Habitat | No. of cavities | Mean orientation | Z-value | P | 95% confidence intervals |
| Valley | 474 | 95.8° | 0.050 | 0.951 | – |
| Low-slope | 342 | 110.9° | 3.651 | 0.026 | 110.9 ± 47.4° |
| High-slope | 388 | 49.4° | 1.711 | 0.181 | – |
| High-gully | 218 | 327.7° | 3.604 | 0.027 | 327.7 ± 51.7° |
| High-plateau | 229 | 341.7° | 4.078 | 0.017 | 341.7 ± 44.3° |
| P values <0.05 are shown in bold. | |||||
| Table 4. Summary of generalized linear mixed models relating density of cavity types to fixed effects. Likelihood ratio test statistics (χ2), probabilities (P), semi-partial marginal determination coefficients (Rm2 [%]) are displayed. Model parameters were considered significant at 5% and are highlighted in bold. | |||||||||||
| Model | Tree species richness | RMS DBH | Topographical spatial variability | ||||||||
| χ2 | P | Rm2 (%) | χ2 | P | Rm2 (%) | χ2 | P | Rm2 (%) | |||
| All density | 43.405 | <0.001 | 4.127 | 20.029 | <0.001 | 1.092 | 133.937 | <0.001 | 22.57 | ||
| Density | |||||||||||
| Cavity height | |||||||||||
| <2 m | 33.484 | <0.001 | 3.325 | 6.807 | 0.009 | 0.442 | 142.781 | <0.001 | 24 | ||
| 2–4 m | 10.833 | 0.001 | 2.702 | 10.922 | 0.001 | 3.437 | 59.892 | <0.001 | 14.927 | ||
| 4–6 m | 2.434 | 0.119 | 0.8 | 0.631 | 0.427 | 0.212 | 17.582 | <0.001 | 9.023 | ||
| 6–8 m | 0.787 | 0.375 | 0.437 | 0.23 | 0.632 | 0.124 | 43.973 | <0.001 | 27.256 | ||
| 8–10 m | 0.032 | 0.857 | 0.164 | 0.059 | 0.809 | 0 | 9.046 | 0.003 | 8.544 | ||
| ≥10 m | 0.447 | 0.504 | 0.251 | 0.194 | 0.659 | 2.072 | 66.813 | <0.001 | 56.919 | ||
| Cavity size | |||||||||||
| 2–5 cm | 4.911 | 0.027 | 1.161 | 1.19 | 0.275 | 0.214 | 136.22 | <0.001 | 29.075 | ||
| 5–15 cm | 23.278 | <0.001 | 2.828 | 6.374 | 0.012 | 0.359 | 74.336 | <0.001 | 14.437 | ||
| 15–30 cm | 13.004 | <0.001 | 3.634 | 15.984 | <0.001 | 1.987 | 50.465 | <0.001 | 21.799 | ||
| 30–60 cm | 4.617 | 0.032 | 3.326 | 1.602 | 0.206 | 0.493 | 19.456 | <0.001 | 34.47 | ||
| Cavity type | |||||||||||
| Butt hollow | 18.32 | <0.001 | 4.863 | 3.036 | 0.081 | 0.068 | 39.474 | <0.001 | 15.029 | ||
| Trunk main | 11.469 | 0.001 | 1.978 | 0.098 | 0.754 | 0.012 | 91.989 | <0.001 | 18.33 | ||
| Trunk top | 23.692 | <0.001 | 4.062 | 0.673 | 0.412 | 0.818 | 43.873 | <0.001 | 14.039 | ||
| Crack | 5.898 | 0.015 | 0.349 | 5.561 | 0.018 | 0.529 | 35.16 | <0.001 | 11.306 | ||
| Branch middle | 18.724 | <0.001 | 0.391 | 14.611 | 0 | 1.401 | 51.162 | 0.001 | 55.476 | ||
| Branch end | 5.412 | 0.02 | 4.444 | 2.02 | 0.155 | 4.951 | 12.815 | 0.541 | 31.914 | ||
| RMS DBH, root mean square diameter of trees at breast height in a given subplot. | |||||||||||