| Table 1. Mean characteristics of the experiments at establishment in the three height classes: Sapling stand stage (SS: H0 < 8m), Energy wood thinning stage (EW: 8m < H0 < 11m) and Pulpwood thinning stage (PW: 12m < H0 > 13m). View in new window/tab. |
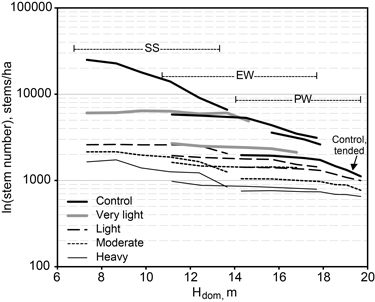
Fig. 1. The mean stem number (on a logarithmic scale) of live trees by first thinning intensity and dominant height during the study period, when the thinning was carried out at the sapling stand stage (SS), at the energy wood thinning stage (EW), and at the pulp wood thinning stage (PW).
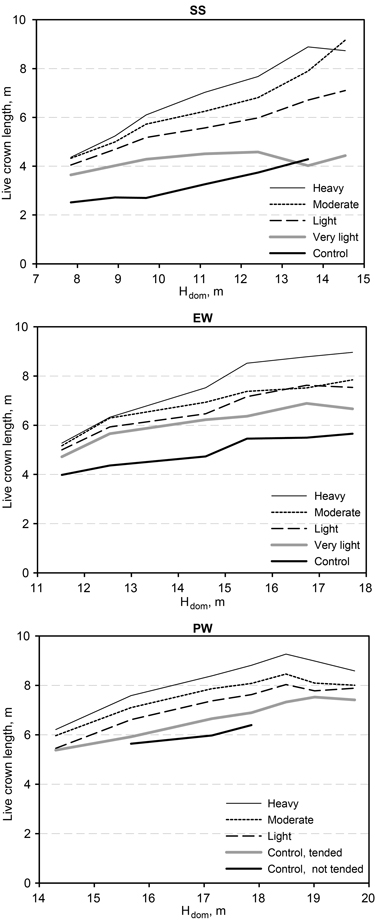
Fig. 2. Estimated live crown length of growing stock as a function of dominant height and treatment of downy birch stands. Dominant height was used as the covariate in Eq. 1 for crown length (i.e., tree height less live crown base). The mean dominant height at each measurement and in each height class (SS = sapling stand stage, EW = energy wood thinning stage, and PW = pulp wood thinning stage) was used in calculation of the estimated means.
| Table 2. Annual mean diameter increment of live trees in two periods for plots of different initial thinning intensities and height classes. Treatments marked with the same letter (within a height class and growth period) are not significantly different (p > 0.05). Site index, H50, was used as the covariate in Eq. 1, and the estimated mean increment was calculated on the basis of the overall mean of H50 (15.3 m) across the entire dataset. | ||||||
| Treatment | Mean diameter growth (mm a–1) in years 1−15 | Mean diameter growth (mm a–1) years 16−Fm (final measurement) | ||||
| Mean for the data | Standard deviation | Estimated mean | Mean for the data | Standard deviation | Estimated mean | |
| SS, sapling stand stage | ||||||
| Heavy | 3.63 | 0.90 | 3.74a | 2.68 | 0.47 | 2.79a |
| Moderate | 2.98 | 0.78 | 2.94b | 2.28 | 0.53 | 2.35ab |
| Light | 2.35 | 0.51 | 2.32bc | 1.71 | 0.60 | 1.83bc |
| Very light | 1.62 | 0.33 | 1.64cd | 1.09 | 0.52 | 1.16c |
| Control | 0.77 | 0.40 | 0.87d | 1.84 | 0.78 | 1.85bc |
| EW, energy-wood thinning stage | ||||||
| Heavy | 3.47 | 0.63 | 3.54a | 1.82 | 0.58 | 1.88a |
| Moderate | 2.76 | 0.53 | 2.79b | 1.15 | 0.35 | 1.37b |
| Light | 2.24 | 0.61 | 2.43bc | 1.14 | 0.36 | 1.23b |
| Very light | 1.92 | 0.64 | 2.15c | 0.87 | 0.11 | 1.22b |
| Control | 0.87 | 0.30 | 1.02d | 1.06 | 1.07 | 1.02b |
| PW, pulpwood thinning stage | ||||||
| Heavy | 2.64 | 0.53 | 2.59a | 1.02 | 0.27 | 1.00a |
| Moderate | 1.95 | 0.47 | 2.12b | 0.74 | 0.07 | 0.78a |
| Light | 1.89 | 0.49 | 1.73c | 0.71 | 0.17 | 0.75a |
| Control. tended | 1.55 | 0.26 | 1.34d | 0.60 | 0.16 | 0.64a |
| Control. not tended a) | 0.72 | 0.14 | 1.17cd | |||
| a) Includes only two plots in one experimental stand. | ||||||
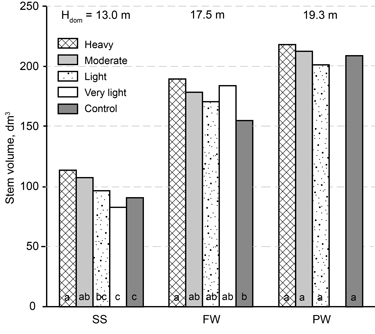
Fig. 3. The influence of thinning intensity on the mean volume of the 600 largest birch stems per hectare at the final measurement in height classes: SS = sapling stand stage, EW = energy wood thinning stage, and PW = pulp wood thinning stage. Treatments denoted by the same letter (within a height class) are not significantly different (p > 0.05). Site index (H50) and stand age at final measurement were used as the covariates in Eq. 1, and the estimates were calculated through the use of their mean values separately for each height class.
| Table 3. Mean annual stem volume increment in two periods for plots with different initial thinning intensities and height classes. For the models, covariates, estimated means and statistical significance, refer to Table 2. | ||||||
| Treatment | Mean volume increment (m3 ha–1 a–1) in years 1−15 | Mean volume increment (m3 ha–1 a–1) in years 16−Fm (final measurement) | ||||
| Mean for the data | Standard deviation | Estimated mean | Mean for the data | Standard deviation | Estimated mean | |
| SS, sapling stand stage | ||||||
| Heavy | 3.01 | 0.84 | 2.97a | 4.37 | 1.50 | 4.81a |
| Moderate | 3.60 | 1.10 | 3.54a | 5.24 | 1.60 | 5.37a |
| Light | 4.27 | 1.25 | 4.40b | 5.26 | 1.11 | 5.56a |
| Very light | 4.89 | 1.35 | 5.38c | 5.84 | 1.50 | 6.17a |
| Control | 5.73 | 1.59 | 5.97c | 6.65 | 1.99 | 7.00a |
| EW, energy-wood thinning stage | ||||||
| Heavy | 4.14 | 1.10 | 3.89a | 4.16 | 1.18 | 4.05a |
| Moderate | 5.04 | 1.18 | 4.65b | 3.99 | 0.83 | 3.96a |
| Light | 5.33 | 1.00 | 5.07bc | 5.22 | 1.75 | 4.85ab |
| Very light | 6.48 | 1.58 | 6.14d | 5.49 | 2.99 | 5.50ab |
| Control | 5.81 | 0.84 | 5.74cd | 6.14 | 2.27 | 5.71b |
| PW, pulpwood thinning stage | ||||||
| Heavy | 4.73 | 1.21 | 4.20a | 2.71 | 0.70 | 2.41a |
| Moderate | 4.85 | 1.15 | 4.69ab | 2.78 | 0.99 | 2.94a |
| Light | 5.18 | 0.94 | 4.79ab | 2.96 | 0.99 | 3.00a |
| Control. tended | 6.13 | 1.07 | 5.30b | 3.41 | 0.70 | 3.36a |
| Control. not tended a) | 5.88 | 0.47 | 6.87c | |||
| a) Includes only two plots in one experimental stand. | ||||||
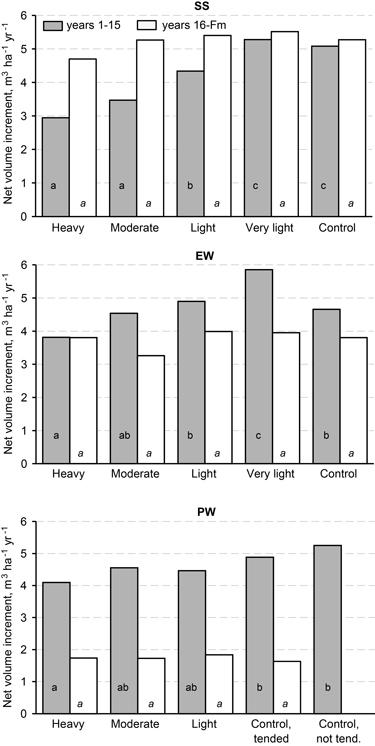
Fig. 4. Mean net volume increment estimates on plots of different thinning intensity and height class in two periods in height classes: SS = sapling stand stage, EW = energy wood thinning stage, and PW = pulp wood thinning stage. For the model used, covariates, estimated means and statistical significance, refer to Table 2.
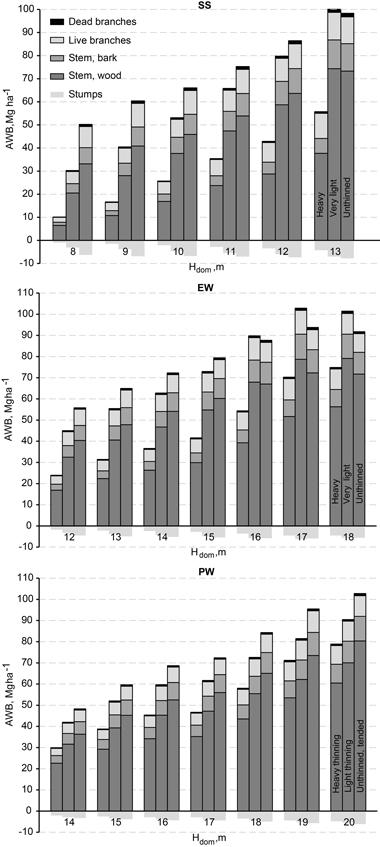
Fig. 5. Mean above-ground woody biomass (AWB) development + stumps of growing stock in downy birch stands by dominant height and treatment in height classes: SS = sapling stand stage, EW = energy wood thinning stage, and PW = pulp wood thinning stage. Dominant height was used as the covariate in Eq. 1, and the models were formulated, and the biomass estimates calculated, through consideration of the mean dominant height separately for each height class at each measurement.
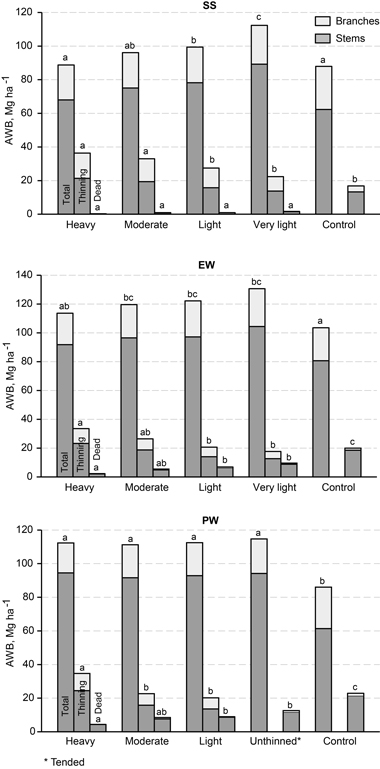
Fig. 6. Estimates of above-ground woody biomass (AWB) production until the end of the study period for different initial thinning intensities in height classes: SS = sapling stand stage, EW = energy wood thinning stage, and PW = pulp wood thinning stage. The total AWB figures include live trees in the final growing stock and in first-thinning removal. Treatments denoted with the same letter (within a height class) are not significantly different (p > 0.05)). Site index, H50, and dominant height at final measurement were used as the covariates in Eq. 1 for total production, and their mean values for each height class (SS: H50 = 14.1 and Hdom = 12.9 m, EW: H50 = 17.2 and Hdom = 17.6 m, PW: H50 = 15.4 and Hdom = 19.0 m) were used in calculation of the estimated means. No covariate was used in models of the removal in thinnings, but the length of the study period was considered in the modelling of mortality: mean period 25 years for EW and PW, 22 years for SS.
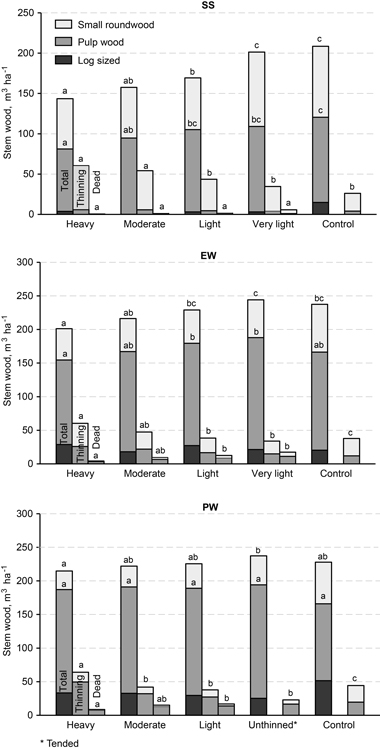
Fig. 7. Estimates of stem wood production until the end of the study period for different initial thinning intensities in height classes: SS = sapling stand stage, EW = energy wood thinning stage, and PW = pulp wood thinning stage. The stem wood was subdivided in to veneer log sized (> 18 cm), pulpwood and small round wood (< 6.5 cm). The total figures include live trees in the final growing stock and in first-thinning removal. For the model used, covariates, estimated means and statistical significance, refer to Fig. 6.
| Table 4. The influence of second thinning on different growth and yield characteristics according to Figs. 2–7 and Tables 2–3. | ||||||
| Characteristic | Unit | EW stage | p- value | PW stage | p- value | Reference |
| Mean volume of 600 thickest trees ha–1 | dm3 | +14 | 0.16 | +46 | 0.00 | Fig. 3 |
| Mean crown length at the end of study | m | +1.7 | 0.00 | +1.7 | 0.00 | Fig. 2 |
| Annual diameter increment | mm a–1 | +0.89 | 0.00 | +0.71 | 0.00 | Tab. 2 |
| Annual stem volume increment | m3 ha–1 a–1 | −0.24 | 0.67 | −0.06 | 0.85 | Tab. 3 |
| Net stem volume increment | m3 ha–1 a–1 | +0.55 | 0.35 | +0.85 | 0.04 | Fig. 4 |
| Total AWB-production | Mg ha–1 | −3.8 | 0.41 | −4.1 | 0.16 | Fig. 5 |
| Thinning outturn of AWB | Mg ha–1 | +19.2 | 0.00 | +21.6 | 0.00 | Fig. 5 |
| Live AWB-production | Mg ha–1 | +3.8 | 0.44 | +6.5 | 0.03 | Fig. 5 |
| Mortality of AWB | Mg ha–1 | −6.7 | 0.00 | −7.5 | 0.00 | Fig. 5 |
| Production of branches | Mg ha–1 | +2.6 | 0.00 | +2.1 | 0.00 | Fig. 5 |
| Thinning outturn of stem volume | m3 ha–1 | +33.4 | 0.00 | +38.6 | 0.00 | Fig. 6 |
| Mortality of stem volume | m3 ha–1 | −11.3 | 0.00 | −12.8 | 0.00 | Fig. 6 |
| Total stem wood production | m3 ha–1 | −3.3 | 0.69 | −14.0 | 0.02 | Fig. 6 |
| Thinning outturn of pulpwood | m3 ha–1 | +18.4 | 0.00 | +32.5 | 0.00 | Fig. 7 |
| Mortality of pulpwood-sized stems | m3 ha–1 | −6.5 | 0.00 | −10.5 | 0.00 | Fig. 7 |
| Production of commercial wood | m3 ha–1 | +1.7 | 0.83 | −2.2 | 0.67 | Fig. 7 |
| Production of small-sized roundwood | m3 ha–1 | +3.0 | 0.00 | +3.0 | 0.00 | Fig. 7 |