| Table 1. Geographical location and environmental factors for three provenances of yellowhorn. | |||||||||
| PRO | Longitude, latitude | Altitude (m) | Mean annual temperature (°C) | January mean temperature (°C) | July mean temperature (°C) | Annual total accumulative temperature above 10 °C | Annual rainfall (mm) | Annual sunshine hours (h) | Frost-free period (d) |
| WQ | 42°57´N, 119°00´E | 623 | 5.8 | –12.5 | 22.5 | 2640 | 320 | 2923 | 130 |
| AQ | 44°13´N, 119°18´E | 550 | 5.5 | –11.5 | 22.9 | 2800 | 340 | 2900 | 120 |
| SX | 34°63´N, 111°62´E | 1026 | 13.9 | –0.7 | 27.0 | 4276 | 650 | 2354 | 219 |
| Table 2. Effects of provenance (PRO), slow-release fertilizer (SRF) and their interaction (PRO × SRF) on N, P, K and soluble sugar content of yellowhorn seedling prior to transplanting. | ||||||||
| Treatment | N content | P content | K content | Soluble sugar content | ||||
| Stem | Root | Stem | Root | Stem | Root | Stem | Root | |
| PRO | NS | NS | * | * | NS | NS | NS | NS |
| SRF | ** | ** | *** | * | NS | NS | *** | NS |
| PRO × SRF | * | NS | NS | NS | NS | NS | ** | *** |
| NS, *, **, *** Non-significant; and significant at p = 0.05, 0.01, 0.001, respectively. | ||||||||
| Table 3. Means ± SE of stem N content, stem and root soluble sugar content of yellowhorn seedling prior to transplanting. | ||||
| Provenance | SRF rate (mg N seedling-1) | Stem N content (mg) | Stem soluble sugar content (mg) | Root soluble sugar content (mg) |
| AQ | 40 | 6.5 ± 1.2 ab | 22.2 ± 1.6 bcd | 36.4 ± 1.1 cde |
| 80 | 8.6 ± 2.7 abc | 24.3 ± 1.4 cde | 43.6 ± 2.7 de | |
| 120 | 18.3 ± 6.6 cde | 12.0 ± 4.5 ab | 38.6 ± 7.6 cde | |
| 160 | 16.8 ± 4.4 bcde | 27.1 ± 1.4 de | 29.2 ± 1.0 bcd | |
| 200 | 24.9 ± 2.1 e | 22.5 ± 3.6 bcd | 30.8 ± 3.0 bcd | |
| SX | 40 | 8.2 ± 1.3 abc | 6.2 ± 1.3 a | 25.1 ± 2.3 abc |
| 80 | 7.3 ± 1.2 ab | 26.6 ± 8.4 de | 46.2 ± 6.8 e | |
| 120 | 12.7 ± 2.9 abcd | 19.0 ± 1.4 bcd | 40.3 ± 4.4 de | |
| 160 | 9.8 ± 1.4 abc | 14.6 ± 2.4 abc | 20.3 ± 8.0 ab | |
| 200 | 20.3 ± 6.7 ade | 23.9 ± 2.7 cde | 32.5 ± 7.0b cde | |
| WQ | 40 | 11.4 ± 1.2 abcd | 14.8 ± 3.0 abc | 41.8 ± 2.6 de |
| 80 | 13.7 ± 2.2 abcd | 33.5 ± 1.6 e | 15.1 ± 0.5 a | |
| 120 | 5.4 ± 0.6 a | 18.8 ± 4.0 bcd | 30.1 ± 4.1 bcd | |
| 160 | 12.2 ± 2.0 abcd | 28.1 ± 0.9 de | 31.7 ± 4.3 bcde | |
| 200 | 9.5 ± 1.4 abc | 18.0 ± 1.3 bcd | 42.8 ± 2.6 de | |
| Values marked with different letters are statistically different according to Duncan’s test (α = 0.05). | ||||
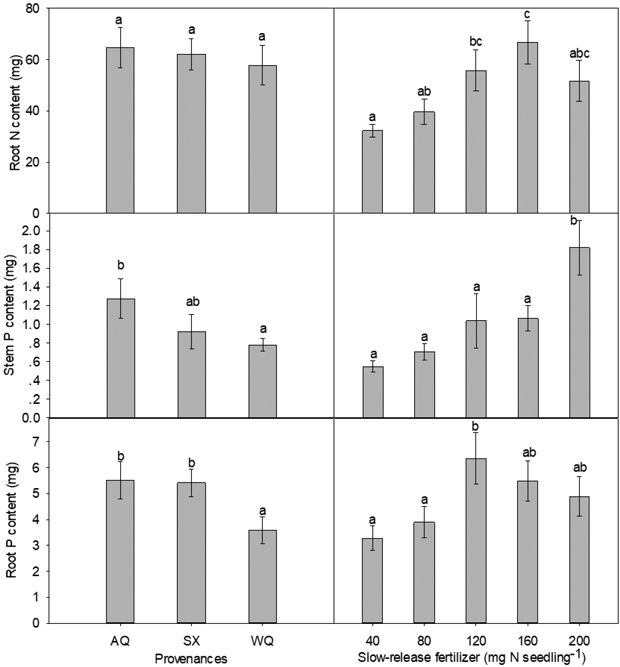
Fig. 1. Main effects of provenance and slow-release fertilizer on nursery stage root N content, stem P content and root P content (mean±SE) of yellowhorn seedlings prior to transplanting. Bars marked with different letters differ significantly for each treatment according to Duncan’s test α = 0.05.
| Table 4. Effects of provenance (PRO), slow-release fertilizer (SRF) and their interaction (PRO × SRF) on yellowhorn seedling stem and root biomass prior to transplanting and at the end of the second growing season (2016, T3). | ||||
| Treatment | Stem biomass | Root biomass | T3 stem biomass | T3 root biomass |
| PRO | NS | ** | NS | NS |
| SRF | ** | NS | ** | *** |
| PRO × SRF | ** | * | NS | NS |
| NS, *, **, *** Non-significant; and significant at p = 0.05, 0.01, 0.001, respectively. | ||||
| Table 5. Means ± SE of stem and root biomass of yellowhorn seedling prior to transplanting. | |||
| Provenance | SRF rate (mg N seedling-1) | Stem biomass (g) | Root biomass (g) |
| AQ | 40 | 0.37 ± 0.04 a | 2.06 ± 0.22 a |
| 80 | 0.54 ± 0.04 bcd | 3.02 ± 0.27 cd | |
| 120 | 0.56 ± 0.07 cde | 2.86 ± 0.34 bcd | |
| 160 | 0.71 ± 0.07 e | 2.06 ± 0.21 a | |
| 200 | 0.58 ± 0.07 cde | 2.11 ± 0.25 ab | |
| SX | 40 | 0.59 ± 0.04 cde | 3.23 ± 0.27 d |
| 80 | 0.39 ± 0.03 ab | 2.42 ± 0.20 abc | |
| 120 | 0.48 ± 0.04 abcd | 2.98 ± 0.26 cd | |
| 160 | 0.60 ± 0.04 cde | 2.78 ± 0.22 abcd | |
| 200 | 0.64 ± 0.06 de | 2.80 ± 0.22 abcd | |
| WQ | 40 | 0.44 ± 0.04 abc | 2.13 ± 0.17 ab |
| 80 | 0.49 ± 0.04 abcd | 2.33 ± 0.23 abc | |
| 120 | 0.57 ± 0.06 cde | 2.27 ± 0.20 abc | |
| 160 | 0.50 ± 0.04 abcd | 2.39 ± 0.21 abc | |
| 200 | 0.48 ± 0.05 abcd | 2.34 ± 0.29 abc | |
| Values marked with different letters are statistically different according to Duncan’s test (α = 0.05). | |||
| Table 6. Effects of provenance (PRO), slow-release fertilizer (SRF) and their interaction (PRO × SRF) on yellowhorn seedling height and diameter at T1, T2, and T3, and survival at T2 and T3. | ||||||||
| Treatment | T1 height | T1 diameter | T2 height | T2 diameter | T3 height | T3 diameter | T2 survival | T3 survival |
| PRO | *** | *** | ** | *** | * | NS | NS | NS |
| SRF | *** | *** | * | *** | NS | ** | NS | NS |
| PRO × SRF | *** | *** | ** | *** | NS | NS | * | ** |
| NS, *, **, *** Non-significant; and significant at p = 0.05, 0.01, 0.001, respectively. T1 means immediately after transplanting. T2 and T3 means at the end of the first (2015) and the second (2016) growing season after transplanting, respectively. | ||||||||
| Table 7. Means ± SE of height and diameter at T1 and T2, and survival at T2 and T3 of yellowhorn seedling. | |||||||
| PRO | SRF rate (mg N seedling-1) | T1 height (cm) | T1 diameter (mm) | T2 height (cm) | T2 diameter (mm) | T2 survival (%) | T3 survival (%) |
| AQ | 40 | 21.9 ± 0.3 bc | 2.9 ± 0.1 a | 32.4 ± 2.7 a | 4.0 ± 0.1 abc | 86.5 ± 9.1 a | 84.6 ± 8.3 abc |
| 80 | 20.3 ± 0.9 b | 2.9 ± 0.0 a | 32.9 ± 2.3 a | 3.9 ± 0.1 ab | 100.0 ± 0.0 b | 87.9 ± 5.4 abc | |
| 120 | 27.4 ± 0.6 e | 3.4 ± 0.1 cd | 41.2 ± 1.5 ab | 4.5 ± 0.0 efg | 100.0 ± 0.0 b | 97.7 ± 2.3 c | |
| 160 | 25.1 ± 0.4 d | 3.2 ± 0.1 b | 34.5 ± 2.3 a | 4.3 ± 0.1 cdef | 100.0 ± 0.0 b | 88.1 ± 4.2 abc | |
| 200 | 18.2 ± 0.2 a | 2.9 ± 0.0 a | 29.4 ± 4.6 a | 4.1 ± 0.2 bcd | 97.7 ± 2.3 ab | 70.5 ± 9.4 a | |
| SX | 40 | 28.7 ± 0.5 e | 3.2 ± 0.1 b | 40.7 ± 2.4 ab | 4.4 ± 0.1 def | 98.3 ± 1.7 ab | 76.7 ± 6.9 a |
| 80 | 21.4 ± 0.9 b | 3.2 ± 0.0 bc | 31.6 ± 2.1 a | 4.2 ± 0.1 bcde | 100.0 ± 0.0 b | 89.6 ± 4.3 abc | |
| 120 | 23.7 ± 0.4 cd | 3.5 ± 0.0 ef | 33.5 ± 0.6 a | 4.8 ± 0.1 g | 90.0 ± 6.4 ab | 75.0 ± 6.3 a | |
| 160 | 28.1 ± 0.6 e | 3.4 ± 0.1 cde | 35.0 ± 2.3 a | 4.6 ± 0.1 fg | 98.2 ± 1.8 ab | 94.8 ± 3.4 bc | |
| 200 | 33.6 ± 0.9 f | 3.6 ± 0.1 f | 49.0 ± 6.1 bc | 4.8 ± 0.1 g | 100.0 ± 0.0 b | 96.5 ± 2.0 bc | |
| WQ | 40 | 21.3 ± 0.7 b | 2.8 ± 0.0 a | 31.0 ± 1.9 a | 3.9 ± 0.1 ab | 100.0 ± 0.0 b | 82.7 ± 7.3 ab |
| 80 | 24.9 ± 0.6 d | 3.1 ± 0.0 b | 37.8 ± 2.9 ab | 4.1 ± 0.1 bcd | 98.5 ± 1.5 ab | 81.5 ± 5.0 ab | |
| 120 | 20.2 ± 0.7 b | 2.9 ± 0.1 a | 41.8 ± 2.4 ab | 3.7 ± 0.2 a | 100.0 ± 0.0 b | 81.7 ± 4.0 ab | |
| 160 | 27.8 ± 0.7 e | 3.6 ± 0.1 f | 48.1 ± 8.7 bc | 4.5 ± 0.0 efg | 100.0 ± 0.0 b | 91.7 ± 3.2 abc | |
| 200 | 26.9 ± 0.3 e | 3.4 ± 0.0 de | 55.7 ± 5.5 c | 4.8 ± 0.0 g | 95.0 ± 2.9 ab | 80.2 ± 5.9 ab | |
| Values marked with different letters are statistically different according to Duncan’s test (α = 0.05). T1 means immediately after transplanting. T2 and T3 means at the end of the first (2015) and the second (2016) growing season after transplanting, respectively. | |||||||
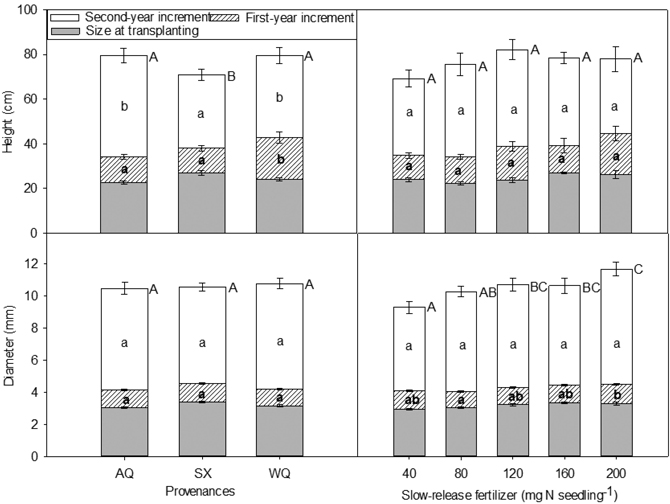
Fig. 2. Height, diameter and their increments in relation to provenance and slow-release fertilizer of yellowhorn seedling at transplanting (T1), at the end of the first (2015, T2) and the second (2016, T3) growing season after transplanting. Error bars represent SE of increments at the end of the first (2015, T2) and the second (2016, T3) growing seasons, and of size at transplanting. Bars marked with different letters differ significantly for total height or diameter (upper case letters) and growth increment (lower case) according to Duncan’s test (α = 0.05), respectively. Comparison letters for height and diameter at T1 and T2 are not presented owing to an occurring interaction.
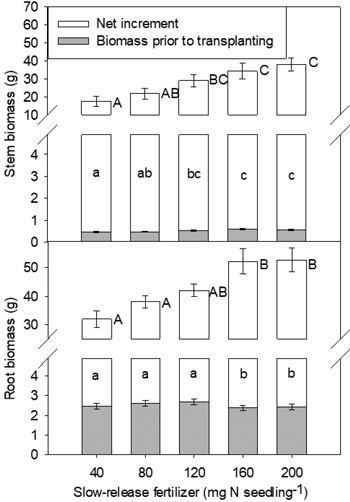
Fig. 3. Yellowhorn seedling stem biomass, root biomass and their increments in relation to slow-release fertilizer (SRF) prior to transplanting and at the end of the second (2016, T3) growing season after transplanting. Error bars represent SE of biomass prior to transplanting and increments at the end of the second growing season (2016, T3). Bars marked with different letters differ significantly for stem or root biomass (upper case letters) and their increments (lower case) according to Duncan’s test (α = 0.05), respectively. Comparison letters for stem and root biomass prior to transplanting are not presented owing to an occurring interaction.