| Table 1. Soil characteristics in the five pH treatments of the greenhouse study A. Total C and N (% of dry matter) was for respective treatment, while P, K, Ca, Mg and Al were analysed for plant-available content (mg g–1 dry matter) with the ammonium lactate (AL) method. na = not available. |
Limestone
(kg m–3 peat) | pH level | CTot | NTot | PAL | KAL | CaAL | MgAL | AlAL |
| (distilled H2O) | (0.01M CaCl2) |
| 6 | 5.7 | 5.1 | 44.0 | 0.82 | 73 | 251 | 1524 | 142 | 15 |
| 4 | 4.9 | 4.5 | na | na | na | na | na | na | na |
| 3 | 4.6 | 4.1 | 49.4 | 0.91 | 74 | 265 | 817 | 138 | 11 |
| 2 | 4.2 | 3.7 | 49.4 | 0.94 | 83 | 287 | 647 | 140 | 11 |
| 0 | 3.4 | 2.9 | 50.6 | 0.96 | 81 | 291 | 66 | 111 | 9 |
| Table 2. Information on the forest soils used in study B. Total C and N content (% of dry matter) was given for each site, while P, K, Ca, Mg and Al were analysed for plant-available content (mg kg–1 dry matter) with the ammonium lactate method. |
| Site | pH level | CTot | NTot | PAL | KAL | CaAL | MgAL | AlAL |
| (distilled H2O) | (0.01M CaCl2) |
| Duveholm | 5.3 | 4.6 | 1.5 | 0.12 | 21 | 70 | 1138 | 162 | 213 |
| Brattön | 4.7 | 3.8 | 4.3 | 0.32 | 26 | 62 | 145 | 44 | 1368 |
| Dimbo | 4.5 | 3.9 | 1.6 | 0.09 | 11 | 9 | 85 | 11 | 393 |
| Toftaholm | 4.4 | 4.0 | 1.5 | 0.09 | 22 | 12 | 65 | 6 | 722 |
| Matteröd | 3.9 | 3.4 | 4.0 | 0.17 | 12 | 12 | 52 | 21 | 940 |
| Table 3. Site characteristics from where the forest study was established. Annual precipitation (Prec.), annual mean temperature (Temp), and annual vegetation length (Veg.) are averages for the period 1961–1990 from the Swedish Meteorological and Hydrological Institute (SMHI). Soil moisture was given according to the classification used at the Swedish National Forest Inventory. |
| Variable | Site |
| Brattön | Dimbo | Duveholm |
| Coordinates (WGS84) | 58°35´N, 11°50´E | 59°07´N, 15°43´E | 58°58´N, 16°09´E |
| Elevation (m a.s.l.) | 135 | 90 | 55 |
| Soil structure | Clay-silt moraine | Sandy moraine & surged gravel | Glacial clay & silty moraine |
| Soil moisture | Mesic-moist | Mesic | Mesic |
| Prec. (mm) | 900 | 500 | 500 |
| Temp. (°C) | 6 | 6 | 6 |
| Veg. (days) | 190 | 190 | 180 |
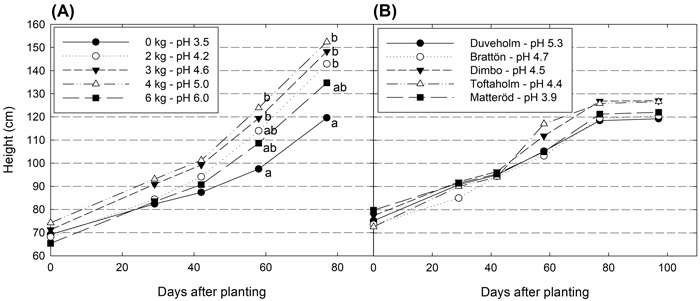
Fig. 1. Height development (cm) for hybrid aspen plants grown in in peat with different pH-levels (A) and in soil collected at five different forest sites (B). Different letters show significant differences among treatments on the measurement occasion (p < 0.05).
| Table 4. Dry mass (g) of leaves, stem, roots and total biomass for plants grown in the different peat soil treatments. Values followed by different letters are significantly different column wise at p < 0.05. The p-value for the analyses of each response variable is also shown. |
| Treatment | Leaves | Stem | Roots | Biomass | S:R ratio |
| pH 3.5 | 9.81 a | 13.94 a | 12.84 a | 36.59 a | 1.9 a |
| pH 4.2 | 19.27 b | 26.10 b | 22.76 b | 68.12 b | 2.1 a |
| pH 4.6 | 18.47 bc | 28.26 b | 24.65 b | 71.38 b | 1.9 a |
| pH 5.0 | 18.10 bc | 27.63 b | 25.05 b | 70.78 b | 1.9 a |
| pH 6.0 | 14.74 c | 20.75 ab | 21.25 ab | 56.74 b | 1.8 a |
| p-value | 0.0001 | 0.0001 | 0.0052 | 0.0001 | 0.7282 |
| Table 5. Results of the statistical analyses on damage, height and diameter three years after planting. |
| Effect p-value |
| Damage | Height | Diameter |
| Site | 0.1288 | 0.3002 | 0.0347 |
| Site prep | 0.1561 | <0.0001 | <0.0001 |
| Site × Site prep | 0.0001 | <0.0001 | 0.0004 |
| Clone | 0.0008 | <0.0001 | <0.0001 |
| Site × Clone | 0.0633 | 0.5334 | 0.3175 |
| Site prep × Clone | 0.2321 | 0.0070 | 0.0296 |
| Site × Site prep × Clone | 0.1623 | 0.8482 | 0.8086 |
| Table 6. Percent damaged plants (Dam, %), plant height (Height, cm) and diameter at 50 cm (Diam, mm) three years after planting in the different site preparation methods at each site. Values followed by different letters are significantly different column wise at p < 0.05. |
| Treatment Brattön | Dimbo | Duveholm |
| Dam | Height | Diam | Dam | Height | Diam | Dam | Height | Diam |
| No site prep | 35 a | 147 ab | 11.2 a | 39 a | 160 a | 10.6 a | 36 a | 176 ab | 6.9 a |
| Patch | 31 a | 144 ab | 6.6 b | 18 b | 113 b | 5.5 b | 42 a | 159 a | 3.4 b |
| Mounding | 24 a | 174 a | 13.6 a | 43 a | 184 a | 11.7 a | 40 a | 174 ab | 7.4 a |
| Inversion | 22 a | 136 b | 6.5 b | 42 a | 167 a | 10.5 a | 51 a | 191 b | 6.2 a |
| Table 7. Cause of damage (%) at different sites during the experimental period. Veg. = competing vegetation and Mech. = mechanical damage and leaning stems. |
| Site | Unknown | Insects | Voles | Moose | Veg. | Climate | Mech. |
| Brattön | 31 | 4 | 1 | 0 | 26 | 12 | 26 |
| Dimbo | 22 | 0 | 1 | 56 | 0 | 1 | 20 |
| Duveholm | 43 | 17 | 31 | 0 | 0 | 0 | 9 |
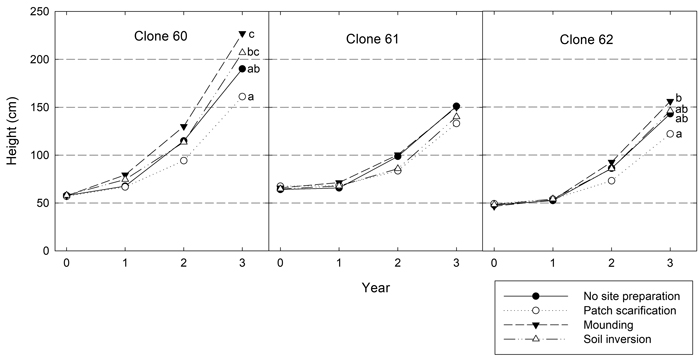
Fig. 2. Height development (cm) for the three clones in the different site preparation treatments. Different letters show significant differences among treatments within the clone after three years (p < 0.05).
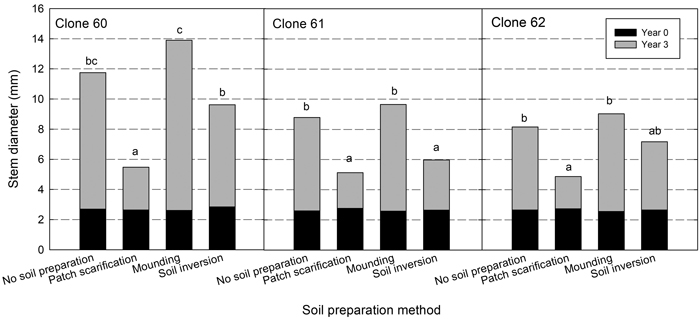
Fig. 3. Diameter (mm) at planting (at the stem base, black bars) and after three years (at 50 cm, black bars plus grey bars) for each clone in the different site preparation treatments. Different letters show significant differences among soil treatments for respective clone after three years (p < 0.05).