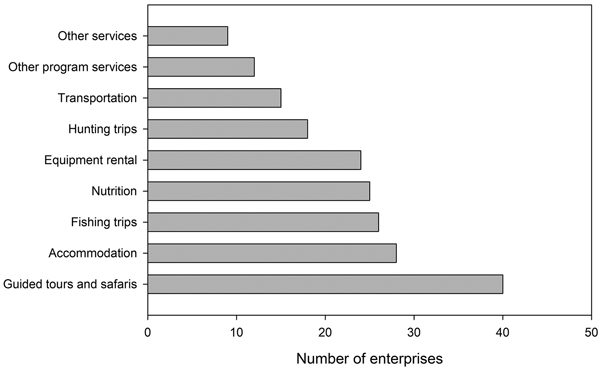
Fig 1. Services offered to customers by nature-based tourism enterprises.
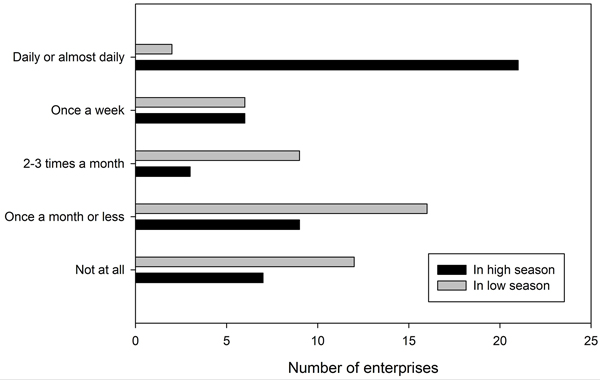
Fig 2. The use of state-owned commercial forest in nature-based tourism during the last 12 months by season.
| Table 1. Descriptions of dependent and independent variables in the models (n = 46). | |||
| Variable name | Description | Mean | SD |
| Dependent variables | |||
| PGrowth | Change in turnover during last five years: 0 = decreased (n = 7), 1 = unchanged (n = 15), 2 = increased (n = 24) | 1.4 | 0.7 |
| EGrowth | Expected change in turnover during next five years: 1 = increase (n = 27), 0 = otherwise (n = 19) | 0.6 | 0.5 |
| Participate | Company’s willingness to participate in potential scenery trading: 0 = no (n = 29), 1 = maybe (n = 12), 2 = yes (n = 5) | 0.5 | 0.7 |
| Independent variables | |||
| 1) Characteristics of enterprise | |||
| Turnover | Company’s turnover during the last 12 months: 1000 euros | 282.7 | 349.7 |
| Services | Number of different services that company offers: 1–10 services | 5.2 | 2.2 |
| Program% | Share of program services of the turnover: 0–100% | 12.2 | 5.9 |
| Accommodation | Company offers accommodation services: 1 = yes (n = 28), 0 = no (n = 18) | 0.6 | 0.5 |
| Bcustomer% | The share of business customers of the total number of customers: 0–100% | 17.3 | 4.6 |
| 2) Characteristics of entrepreneur | |||
| Experience | Entrepreneur’s experience as an entrepreneur: years | 16.2 | 9.7 |
| Risk-taker | Entrepreneur’s attitude to risk: 1 = risk-taker (n = 27), 0 = risk-averse (n = 19) | 0.6 | 0.5 |
| Newbusiness | Entrepreneur’s intention to develop new NBT business: 1 = yes (n = 21), 0 = no (n = 25) | 0.5 | 0.5 |
| 3) Use of state-owned commercial forests and activities encountered in forests | |||
| Usehigh | How often company uses state-owned commercial forest during the high season: 1–5, from not at all to daily or almost daily | 3.5 | 1.6 |
| Hiking | Company uses state-owned commercial forest for hiking camping (overnight) activities: 1 = yes (n = 11), 0 = no (n = 35) | 0.2 | 0.4 |
| Snowmobiling | Company uses state-owned commercial forest for snowmobiling activities: 1 = yes (n = 25), 0 = no (n = 21) | 0.5 | 0.5 |
| Nordicwalking | Company uses state-owned commercial forest for Nordic walking activities: 1 = yes (n = 18), 0 = no (n = 28) | 0.4 | 0.5 |
| Cross-country | Company uses state-owned commercial forest for cross-country skiing activities: 1 = yes (n = 14), 0 = no (n = 32) | 0.3 | 0.5 |
| Fishing | Company uses state-owned commercial forest for fishing activities: 1 = yes (n = 17), 0 = no (n = 29) | 0.4 | 0.5 |
| Sledding | Company uses state-owned commercial forest for sledding activities: 1 = yes (n = 7), 0 = no (n = 39) | 0.2 | 0.4 |
| Table 2. Factors explaining the past and expected growth of nature-based tourist enterprises. | ||||||
| Model 1 (PGrowth) | Model 2 (EGrowth) | |||||
| Explanatory variable | Coefficient | Standard error | p-value | Coefficient | Standard error | p-value |
| Constant | 0.80119 | 0.76993 | 0.2981 | –5.03746 | 1.98556 | 0.0112 |
| Turnover | 0.00612 | 0.00199 | 0.0021 | 0.00454 | 0.00235 | 0.0530 |
| Risk-taker | –1.48997 | 0.53291 | 0.0052 | 3.72959 | 1.20213 | 0.0019 |
| Usehigh | –0.33300 | 0.17625 | 0.0588 | –0.93256 | 0.43518 | 0.0321 |
| Hiking | 3.21506 | 0.93994 | 0.0006 | 2.25328 | 1.26496 | 0.0749 |
| Snowmobiling | –1.23427 | 0.54133 | 0.0226 | –0.65759 | 0.91770 | 0.4736 |
| Threshold parameter | ||||||
| Mu(1) | 2.07667 | 0.51873 | 0.0001 | |||
| Log likelihood | –24.17877 | –17.92757 | ||||
| Pseudo R-squared | 0.46979 | 0.42513 | ||||
| AIC | 62.4 | 47.9 | ||||
| Table 3. Factors explaining respondents’ willingness to participate in landscape and recreational values trading (LRVT). Y = participate (1 = yes, 0 = no) | |||
| Explanatory variable | Coefficient | Standard error | p-value |
| Constant | 0.32067 | 0.66290 | 0.6286 |
| Turnover | 0.00537 | 0.00177 | 0.0025 |
| Newbusiness | 3.18345 | 1.24617 | 0.0106 |
| Accommodation | –3.41820 | 1.27322 | 0.0073 |
| Program% | –0.26572 | 0.10421 | 0.0108 |
| Hiking camping | –4.19251 | 1.57611 | 0.0078 |
| Cross-country skiing | –3.10572 | 1.33145 | 0.0197 |
| Nordic walking | 8.22564 | 3.11269 | 0.0082 |
| Fishing | 4.93116 | 1.83684 | 0.0073 |
| Sledding | 2.26629 | 1.23403 | 0.0663 |
| Threshold parameter | |||
| Mu(1) | 3.07900 | 1.06397 | 0.0038 |
| Log likelihood | –15.01020 | ||
| Pseudo R-squared | 0.63028 | ||
| AIC | 52.0 | ||
| Table 4. Characteristics of enterprises and entrepreneurs explaining the growth and expected growth of nature-based tourist enterprises. | ||||||
| Model 3 (PGrowth) | Model 4 (EGrowth) | |||||
| Explanatory variable | Coefficient | Standard error | p-value | Coefficient | Standard error | p-value |
| Constant | 3.64450 | 1.36492 | 0.0076 | 1.95737 | 3.14537 | 0.5337 |
| Turnover | 0.00394 | 0.00125 | 0.0016 | 0.00327 | 0.00201 | 0.1032 |
| Accommodation | 0.94949 | 0.49871 | 0.0569 | 1.90584 | 1.19664 | 0.1112 |
| Services | –0.16161 | 0.10400 | 0.1202 | –0.11060 | 0.24367 | 0.6499 |
| Bcustomer% | –0.05790 | 0.05080 | 0.2544 | –0.29196 | 0.14835 | 0.0491 |
| Experience | –0.05848 | 0.02374 | 0.0138 | 0.00911 | 0.05708 | 0.8732 |
| Risk-taker | –1.23918 | 0.53421 | 0.0204 | 1.82889 | 1.12739 | 0.1048 |
| Newbusiness | –0.07518 | 0.44111 | 0.8647 | 2.86871 | 1.09677 | 0.0089 |
| Threshold parameter | ||||||
| Mu(1) | 1.58886 | 0.36391 | <0.0001 | |||
| Log likelihood | –30.28370 | –15.27105 | ||||
| Pseudo R-squared | 0.33591 | 0.51032 | ||||
| AIC | 78.6 | 46.5 | ||||