| Table 1. Locations, areas, and main characteristics of the growing stock in eight sample plots at the beginning of the pruning experiment in spring 2004 and after six growing seasons in winter 2009–2010. | ||||||||||
| Stand, location and coordinates (WGS84) | Plot | Plot area, m3 | Number of stems, ha–1 | Crown base, m | Dominant height, m | Mean dbh, mm | Volume, m3 ha–1 | |||
| 2004 | 2004 | 2004 | 2010 | 2004 | 2010 | 2004 | 2010 | |||
| A Padasjoki (61°26´N, 25°06´E) | 1 | 680 | 1838 | 3.2 | 11.5 | 16.6 | 94 | 124 | 65 | 143 |
| 2 | 990 | 1444 | 2.0 | 12.2 | 15.5 | 96 | 130 | 47 | 116 | |
| B Kuhmoinen (61°36´N, 25°18´E) | 3 | 770 | 1481 | 1.3 | 10.4 | 15.7 | 79 | 117 | 31 | 102 |
| 4 | 1076 | 1571 | 1.7 | 9.6 | 15.2 | 73 | 109 | 25 | 83 | |
| 5 | 828 | 1546 | 2.0 | 11.4 | 17.5 | 88 | 121 | 44 | 120 | |
| C Parkano (62°02´N, 23°02´E) | 6 | 600 | 1650 | 3.2 | 12.1 | 17.1 | 102 | 138 | 66 | 158 |
| 7 | 600 | 1650 | 3.3 | 11.9 | 16.9 | 102 | 139 | 66 | 161 | |
| D Parkano (61°59´N, 22°56´E) | 8 | 600 | 2033 | 3.1 | 11.4 | 16.2 | 93 | 126 | 63 | 167 |
| Mean | 768 | 1652 | 2.5 | 11.3 | 16.4 | 91 | 126 | 51 | 131 | |
| Table 2. Numbers (N), mean diameters at breast height (dbh) over bark in spring 2004 and winter 2009–2010, and annual dbh increments of felled study trees during the experiment for different pruning treatments (standard deviations presented in parentheses and ranges between minimum and maximum values). | ||||||||
| dbh 2004, mm | dbh 2010, mm | dbh increment, mm a–1 | ||||||
| Pruning method | Pruning date | N | Mean (Sd) | Range (min-max) | Mean (Sd) | Range (min-max) | Mean (Sd) | Range (min-max) |
| Secateurs | 19.3.2004 | 8 | 97 (13) | 79–117 | 134 (11) | 119–149 | 6.2 (1.2) | 4.4–8.0 |
| Saw | 19.3.2004 | 8 | 95 (16) | 73–123 | 131 (18) | 100–155 | 5.9 (1.0) | 4.5–7.5 |
| Secateurs | 29.4.2004 | 8 | 88 (16) | 64–113 | 124 (15) | 102–143 | 5.9 (0.8) | 4.8–7.2 |
| Secateurs | 3.6.2004 | 8 | 93 (10) | 75–103 | 133 (11) | 118–152 | 6.7 (1.7) | 4.3–9.2 |
| Secateurs | 23.6.2004 | 8 | 96 (9) | 80–103 | 131 (13) | 113–145 | 5.9 (1.1) | 4.9–7.6 |
| Secateurs | 15.7.2004 | 8 | 91 (14) | 76–117 | 124 (15) | 105–149 | 5.4 (1.3) | 3.4–7.8 |
| Saw | 15.7.2004 | 8 | 92 (12) | 75–106 | 130 (20) | 101–159 | 6.3 (2.1) | 2.9–9.8 |
| Secateurs | 5.8.2004 | 8 | 95 (14) | 68–119 | 135 (21) | 104–176 | 6.6 (1.4) | 5.1–9.5 |
| Secateurs | 26.8.2004 | 8 | 96 (22) | 64–136 | 139 (31) | 96–191 | 7.1 (1.9) | 4.5–9.3 |
| Saw | 26.8.2004 | 8 | 98 (20) | 69–118 | 134 (22) | 97–161 | 5.9 (0.9) | 4.7–7.2 |
| Secateurs | 16.9.2004 | 8 | 95 (16) | 79–119 | 136 (21) | 115–166 | 6.8 (1.2) | 5.3–9.0 |
| Stick | autumn 2004 | 8 | 87 (13) | 70–104 | 122 (17) | 101–149 | 5.8 (1.5) | 2.8–7.4 |
| Stick | spring 2005 | 8 | 90 (15) | 70–115 | 127 (14) | 106–146 | 6.1 (1.2) | 3.8–7.3 |
| Control | not pruned | 8 | 96 (15) | 76–123 | 131 (14) | 114–153 | 5.9 (0.6) | 5.0–6.8 |
| ALL DATA | 112 | 94 (14) | 64–136 | 131 (18) | 96–191 | 6.2 (1.3) | 2.8–9.8 | |
| Table 3. Main characteristics of study branches. Numbers (N) and mean vertical diameters (measured in 2004 over bark) are presented for living, dead, and all branches in total and separately for different pruning treatments (standard deviations in parentheses and ranges between minimum and maximum values). Cumulative radial increments (over bark) of felled study trees at the height of each branch during five to six growing seasons were also determined for all branches. | ||||||||||||
| N of branches | Branch diameter, mm | Radial increment, mm | ||||||||||
| Pruning method | Pruning date | All | Living | Dead | All branches | Living branches | Dead branches | All branches | ||||
| Mean (SD) | Range | Mean (SD) | Range | Mean (SD) | Range | Mean (SD) | Range | |||||
| Secateurs | 19.3. | 146 | 43 | 103 | 15.6 (4.3) | 4–29 | 14.9 (3.6) | 8–24 | 15.9 (4.5) | 4–29 | 20.3 (3.4) | 12.5–28.2 |
| Saw | 19.3. | 119 | 39 | 80 | 16.1 (5.8) | 5–40 | 16.5 (4.6) | 10–31 | 15.9 (6.3) | 5–40 | 18.8 (3.2) | 12.5–24.9 |
| Secateurs | 29.4. | 129 | 69 | 60 | 13.8 (4.9) | 4–36 | 15.9 (4.2) | 10–36 | 11.3 (4.4) | 4–22 | 18.8 (2.5) | 12.8–24.1 |
| Secateurs | 3.6. | 131 | 78 | 53 | 15.0 (4.9) | 4–32 | 16.2 (4.1) | 9–32 | 13.1 (5.3) | 4–27 | 22.1 (5.4) | 12.8–31.6 |
| Secateurs | 23.6. | 128 | 55 | 73 | 14.1 (4.9) | 5–34 | 14.9 (3.3) | 9–23 | 13.6 (5.7) | 5–34 | 18.1 (3.9) | 13.4–27.7 |
| Secateurs | 15.7. | 119 | 54 | 65 | 13.9 (4.0) | 5–25 | 15.4 (3.8) | 10–25 | 12.7 (3.8) | 5–22 | 14.9 (3.1) | 7.3–20.4 |
| Saw | 15.7. | 125 | 68 | 57 | 17.4 (7.3) | 4–50 | 19.1 (5.6) | 10–32 | 15.4 (8.6) | 4–50 | 18.8 (5.8) | 7.4–30.1 |
| Secateurs | 5.8. | 125 | 67 | 58 | 15.7 (5.0) | 5–34 | 16.8 (4.7) | 8–34 | 14.3 (5.0) | 5–29 | 17.2 (3.3) | 12.4–25.2 |
| Secateurs | 26.8. | 99 | 50 | 49 | 14.6 (4.9) | 4–35 | 16.7 (4.7) | 9–35 | 12.5 (4.3) | 4–24 | 17.9 (4.6) | 9.2–25.3 |
| Saw | 26.8. | 114 | 37 | 77 | 16.1 (6.1) | 5–40 | 19.6 (5.7) | 12–40 | 14.4 (5.6) | 5–30 | 15.2 (1.8) | 11.5–18.3 |
| Secateurs | 16.9. | 123 | 44 | 79 | 14.1 (5.2) | 4–35 | 14.5 (3.3) | 9–24 | 13.9 (6.1) | 4–35 | 17.6 (2.9) | 13.0–23.5 |
| Stick | autumn 2004 | 78 | - | 78 | 11.2 (4.2) | 3–25 | - | - | 11.2 (4.2) | 3–25 | 15.6 (2.3) | 10.0–20.4 |
| Stick | spring 2005 | 85 | - | 85 | 10.2 (3.0) | 4–16 | - | - | 10.2 (3.0) | 4–16 | 14.8 (2.1) | 11.8–21.9 |
| Control | no pruned | 116 | 36 | 80 | 9.3 (4.0) | 2–21 | 12.9 (3.1) | 7–21 | 7.8 (3.2) | 2–17 | 18.4 (4.4) | 7.3–26.4 |
| ALL DATA | 1637 | 640 | 997 | 14.3 (5.5) | 2–50 | 16.2 (4.6) | 7–40 | 13.0 (5.6) | 2–50 | 18.0 (4.2) | 7.3–31.6 | |
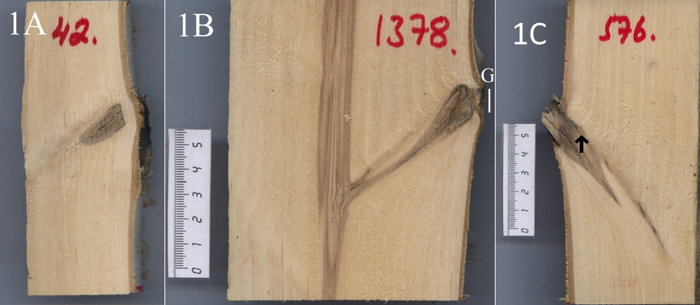
Fig. 1. Three scanned images of study knots: Knot 1A: a 12-mm-thick knot occluded without discolouration (occlusion class 1). The occlusion gap was closed and the occlusion rate was set to 100%. Knot 1B: occlusion started from the up and down sides of a 16-mm-thick knot (class 3). Because the occlusion gap (G) was 7.7 mm long, the occlusion percentage was 52%. Knot 1C: vertical diameter of the knot was 13 mm and the occlusion gap was not measured because no occlusion was observed (class 6). The occlusion rate was set to 0%. A small discolouration in the stemwood (upward only↑) was also detected.
| Table 4. Observation methods used in this study to identify external and internal occlusion classes as well as occlusion percentages for knots in alternative pruning treatments and four differently formulated models to analyse the knot occlusion. | ||||
| Dependent variable of occlusion | External occlusion class | Internal occlusion class | Occlusion percentage of a knot | |
| Origin | From stem surface | From split knots | From split knots | |
| Observation method | External evaluation, 6 classes | Internal evaluation, 8 classes | Exact measurement (0.1 mm), occlusion % of a knot | |
| Model formulation | Not modelled | Ordinal regression models with mixed-effects (Eq. 2–4) | Linear mixed models (Eq. 5) | |
| Modelling: | ||||
| 1) Effect of pruning date | Data: Treatments: | MODEL 1 1000 knots Secateurs 8 dates | ||
| 2) Effect of pruning method and season | Data: Treatments: | MODEL 2 1001 knots 1) Secateurs 3 dates Saw 3 dates Stick 2 dates Control | MODELS 3 and 4 1334 knots Secateurs 8 dates Saw 3 dates | |
| 1) includes only equal dates for saw and secateurs pruning. | ||||
| Table 5. Distribution of silver birch knots into occlusion classes according to the pruning method (sc = secateurs, sw = saw, stick = stick pruning) and date. Classification is made internally from the cross-cut surface of longitudinally split knots five to six growing seasons after pruning. | ||||||||||||||||
| Number of knots according to different pruning treatments (i.e., various methods and dates) | ||||||||||||||||
| Sc | Sw | Sc | Sc | Sc | Sc | Sw | Sc | Sc | Sw | Sc | Stick | Stick | Control | Total | ||
| Occlusion class | 19.3. | 19.3. | 29.4. | 3.6. | 23.6. | 15.7. | 15.7. | 5.8. | 26.8. | 26.8. | 16.9. | autumn | spring | N | % | |
| 1 – Occluded without discolouration | 46 | 34 | 27 | 28 | 16 | 6 | 18 | 13 | 10 | 19 | 18 | 10 | 5 | 3 | 253 | 15 |
| 2 - Occluded with some discolouration | 67 | 59 | 53 | 65 | 30 | 26 | 57 | 27 | 21 | 23 | 28 | 27 | 27 | 3 | 513 | 31 |
| 3 - Partly occluded from both the up- and downside of the knot | 21 | 22 | 27 | 23 | 26 | 30 | 27 | 24 | 22 | 26 | 19 | 10 | 4 | 1 | 282 | 17 |
| 4 - Partly occluded from either the up- or downside of the knot | 10 | 1 | 17 | 14 | 37 | 28 | 10 | 47 | 21 | 20 | 35 | 8 | 11 | 2 | 261 | 16 |
| 5 - Occlusion just started, a visible pro-trusion outside the knot | 2 | 3 | 4 | 0 | 12 | 20 | 6 | 9 | 13 | 17 | 19 | 4 | 6 | 0 | 115 | 7 |
| 6 - Occlusion not started | 0 | 0 | 1 | 1 | 7 | 9 | 7 | 5 | 12 | 9 | 4 | 19 | 32 | 3 | 109 | 7 |
| 7 - Unpruned dead branch | 0 | 0 | 0 | 0 | 0 | 0 | 0 | 0 | 0 | 0 | 0 | 0 | 0 | 92 | 92 | 6 |
| 8 - Unpruned living branch | 0 | 0 | 0 | 0 | 0 | 0 | 0 | 0 | 0 | 0 | 0 | 0 | 0 | 12 | 12 | 1 |
| All knots | 146 | 119 | 129 | 131 | 128 | 119 | 125 | 125 | 99 | 114 | 123 | 78 | 85 | 116 | 1637 | 100 |
| All knots of living branches | 43 | 39 | 69 | 78 | 55 | 54 | 68 | 67 | 50 | 37 | 44 | - | - | 36 | 640 | 39 |
| All knots of dead branches | 103 | 80 | 60 | 53 | 73 | 65 | 57 | 58 | 49 | 77 | 79 | 78 | 85 | 80 | 997 | 61 |
| Table 6. Parameter estimates and standard errors (S.E) of the ordinal regression model with mixed effects (Model 1) predicting the probability of an internally evaluated occlusion class (categories 1–6 in Table 5) for a branch pruned by secateurs at eight alternative dates (N = 1000). | ||||
| MODEL 1 | ||||
| Threshold coefficients | Estimate | S.E. | z value | |
| Occlusion classes 1|2 | –1.3515 | 0.721 | –1.874 | |
| Occlusion classes 2|3 | 0.6887 | 0.722 | 0.955 | |
| Occlusion classes 3|4 | 1.9124 | 0.723 | 2.644 | |
| Occlusion classes 4|5 | 3.7859 | 0.730 | 5.183 | |
| Occlusion classes 5|6 | 5.2673 | 0.744 | 7.078 | |
| Parameter | Estimate | S.E. | z value | Sig. |
| Horizontal diameter of a branch, mm | 0.1689 | 0.019 | 8.830 | <0.001 |
| Cumulative net radial increment over bark in 5–6 years, mm | –0.1644 | 0.029 | –5.597 | <0.001 |
| Treatment (ref. secateurs 19.3.) | ||||
| - secateurs 29.4. | 0.9643 | 0.442 | 2.181 | 0.029 |
| - secateurs 3.6. | 1.0562 | 0.443 | 2.387 | 0.017 |
| - secateurs 23.6. | 2.1187 | 0.447 | 4.744 | <0.001 |
| - secateurs 15.7. | 2.2457 | 0.468 | 4.796 | <0.001 |
| - secateurs 5.8. | 2.0378 | 0.452 | 4.508 | <0.001 |
| - secateurs 26.8. | 2.5737 | 0.457 | 5.629 | <0.001 |
| - secateurs 16.9. | 1.8757 | 0.450 | 4.171 | <0.001 |
| Vitality of a branch (ref. living branch) | ||||
| - dead branch | 0.4315 | 0.140 | 3.081 | 0.002 |
| Random part | Variance | SD | ||
| Stand effect (δstand2) (N = 4) | 0.1276 | 0.3572 | ||
| Sample tree effect (δtree2) (N = 64) | 0.5421 | 0.7363 | ||
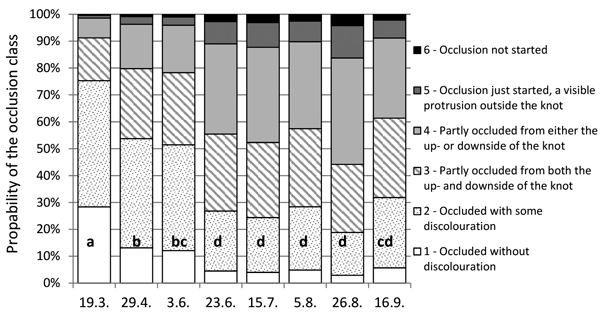
Fig. 2. Effect of the pruning date on the occlusion of 15-mm thick secateurs-pruned living branches with the cumulative 18-mm net radial growth (over bark at the branch height) according to Model 1. Percentage bars illustrate the probabilities of these branches pruned at eight alternative dates to fall into different occlusion classes. The same letter (a, b, c or d) in the bars indicates an insignificant difference (p > 0.05) in the occlusion between the pruning dates.
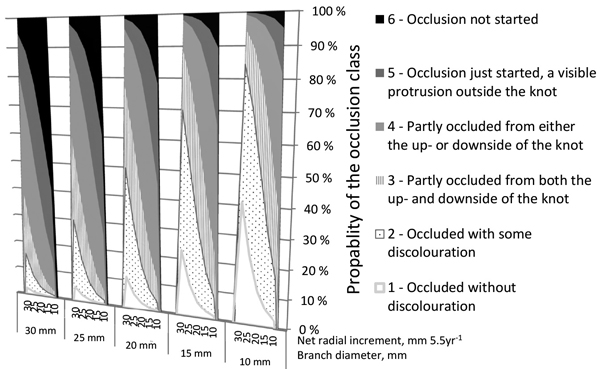
Fig. 3. Effects of the horizontal diameter of a branch (mm) and the cumulative net radial increment over bark (mm) of a tree (at the height of the branch) on the estimated probabilities of occlusion classes in the case of living branches pruned with secateurs on 15 July, according to Model 1. The percentage characterizes the probability of a branch to fall into a certain occlusion class.
| Table 7. Parameter estimates and standard errors (S.E.) of the ordinal regression model (Model 2) with mixed-effects predicting the internally evaluated occlusion class (categories 1–8 in Table 5) for a branch pruned by saw, secateurs, or stick or unpruned (control) (N = 1001). | ||||
| MODEL 2 | ||||
| Threshold coefficients | Estimate | S.E. | z value | |
| Occlusion classes 1|2 | –1.8186 | 0.835 | –2.179 | |
| Occlusion classes 2|3 | 0.3571 | 0.835 | 0.428 | |
| Occlusion classes 3|4 | 1.5259 | 0.837 | 1.823 | |
| Occlusion classes 4|5 | 2.5602 | 0.838 | 3.054 | |
| Occlusion classes 5|6 | 3.4792 | 0.842 | 4.134 | |
| Occlusion classes 6|7 | 6.3755 | 0.907 | 7.032 | |
| Occlusion classes 7|8 | 12.0251 | 1.115 | 10.782 | |
| Parameter | Estimate | S.E. | z value | Sig. |
| Horizontal diameter of a branch, mm | 0.1158 | 0.018 | 6.279 | <0.001 |
| Cumulative net radial increment over bark in 5–6 years, mm | –0.1381 | 0.035 | –3.935 | <0.001 |
| Treatment (ref. secateurs 19.3.) | ||||
| - saw 19.3. | –0.0129 | 0.577 | –0.022 | 0.982 |
| - secateurs 15.7. | 1.9503 | 0.602 | 3.242 | 0.001 |
| - saw 15.7. | 0.8946 | 0.580 | 1.543 | 0.123 |
| - secateurs 26.8. | 2.1518 | 0.584 | 3.684 | <0.001 |
| - saw 26.8. | 1.3180 | 0.599 | 2.200 | 0.028 |
| - stick in autumn 2004 | 2.1664 | 0.617 | 3.513 | <0.001 |
| - stick in spring 2005 | 2.7407 | 0.620 | 4.418 | <0.001 |
| - no pruning (control) | 10.1923 | 0.786 | 12.968 | <0.001 |
| Random part | Variance | SD | ||
| Stand effect (δstand2) (N = 4) | 0.1813 | 0.426 | ||
| Sample tree effect (δtree2) (N = 72) | 1.0877 | 1.043 | ||
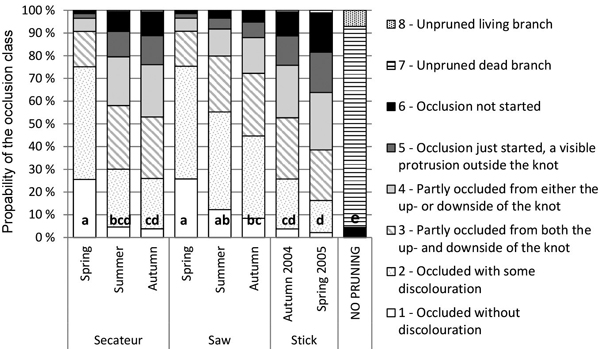
Fig. 4. Effects of the pruning method and timing on the occlusion of 15-mm thick branches with the cumulative 18-mm net radial growth (over bark at the branch height) according to Model 2. The percentage bars illustrate the probabilities of these branches to fall into different occlusion classes. The same letter (a, b, c, d or e) in the bars indicates an insignificant difference in (p > 0.05) the occlusion between the treatments.
| Table 8. Numbers (N) and mean occlusion percentages with standard deviations (SD) of studied branches pruned by secateurs (Sc) and saw (Sw) at different dates during the growing season in 2004. Occlusion percentages for branches were evaluated five to six years after pruning. | ||||||||||||
| Pruning method and date | ||||||||||||
| Sc | Sw | Sc | Sc | Sc | Sc | Sw | Sc | Sc | Sw | Sc | ALL | |
| 19.3. | 19.3. | 29.4. | 3.6. | 23.6. | 15.7. | 15.7. | 5.8. | 26.8. | 26.8. | 16.9. | ||
| Living branches | ||||||||||||
| N | 42 | 37 | 68 | 78 | 54 | 51 | 68 | 67 | 47 | 36 | 44 | 592 |
| Mean percentage | 95.0 | 90.3 | 85.3 | 86.8 | 72.3 | 61.4 | 79.6 | 50.2 | 48.0 | 60.4 | 61.1 | 72.4 |
| SD | 15.3 | 23.2 | 23.3 | 24.2 | 32.4 | 30.7 | 32.1 | 31.3 | 38.6 | 39.7 | 34.5 | 33.5 |
| Dead branches | ||||||||||||
| N | 101 | 79 | 57 | 52 | 70 | 64 | 57 | 58 | 48 | 77 | 79 | 742 |
| Mean percentage | 88.8 | 88.8 | 74.9 | 87.3 | 46.5 | 40.3 | 69.8 | 58.0 | 50.9 | 53.5 | 49.4 | 65.3 |
| SD | 23.4 | 24.7 | 33.0 | 23.1 | 40.1 | 40.3 | 40.7 | 39.7 | 42.8 | 40.8 | 43.0 | 40.0 |
| All branches | ||||||||||||
| N | 143 | 116 | 125 | 130 | 124 | 115 | 125 | 125 | 95 | 113 | 123 | 1334 |
| Mean percentage | 90.6 | 89.3 | 80.6 | 87.0 | 57.7 | 49.7 | 75.1 | 53.8 | 49.4 | 55.7 | 53.6 | 68.4 |
| SD | 21.4 | 24.1 | 28.5 | 23.7 | 39.0 | 37.7 | 36.4 | 35.5 | 40.6 | 40.4 | 40.4 | 37.4 |
| Table 9. Parameter estimates and standard errors (S.E.) for Models 3 and 4 to estimate the arcsine transformation of the occlusion rate (0–1) for a saw or secateurs pruned branch (N = 1334). AIC = Akaike’s information criterion. | ||||||
| MODEL 3 | MODEL 4 | |||||
| Parameter | Estimate | S.E. | Sig. | Estimate | S.E. | Sig. |
| Fixed part | ||||||
| Intercept | 0.30398 | 0.30378 | 0.3188 | 1.09016 | 0.20446 | <0.001 |
| Vitality of a branch (ref. dead) | ||||||
| - living | 0.08389 | 0.02800 | 0.0028 | 0.08189 | 0.02800 | 0.004 |
| Pruning method (ref. saw) | ||||||
| - secateurs | –0.25935 | 0.05614 | <0.001 | –0.27642 | 0.05785 | <0.001 |
| Pruning in spring (ref. no) | ||||||
| - yes | 0.31139 | 0.06044 | <0.001 | 0.38542 | 0.05958 | <0.001 |
| Pruning in autumn (ref. no) | ||||||
| - yes | –0.10047 | 0.06293 | 0.1144 | –0.14228 | 0.06505 | 0.032 |
| Ln(vertical diameter of a branch, mm) | –0.53603 | 0.03541 | <0.001 | –0.53061 | 0.03538 | <0.001 |
| Ln(cumulative net radial increment over bark, mm) | 0.72287 | 0.10672 | <0.001 | |||
| Ln(dbh increment over bark, mm a–1) | 0.69200 | 0.10401 | <0.001 | |||
| Height of a branch, dm | 0.00707 | 0.00132 | <0.001 | 0.00967 | 0.00127 | <0.001 |
| Random part | ||||||
| Random error (δe2) | 0.15580 | 0.00626 | 0.15516 | 0.00623 | ||
| Stand effect (δstand2) (N = 4) | 0.00596 | 0.00767 | 0.00668 | 0.00810 | ||
| Sample tree effect (δtree2) (N = 88) | 0.04245 | 0.00859 | 0.04519 | 0.00895 | ||
| AIC | 1491 | 1490 | ||||
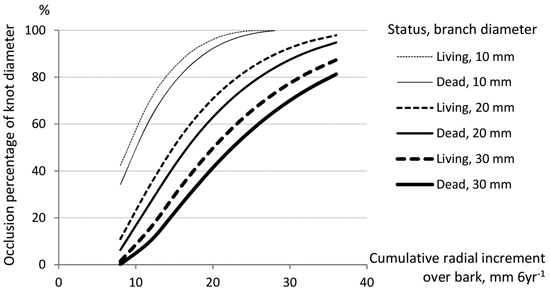
Fig. 5. Occlusion percentages (% of branch diameter) estimated by Model 3 for living and dead branches pruned by secateurs in spring according to the vertical diameter of a branch and the cumulative radial increment of a stem at the branch height of 25 dm (during six growing seasons after pruning, good occlusion rate).
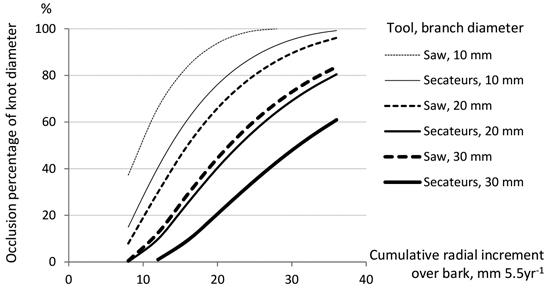
Fig. 6. Occlusion percentages (% of branch diameter) estimated by Model 3 for living branches pruned by saw or secateurs in summer according to the vertical diameter of a branch and the cumulative radial increment of a stem at the branch height of 25 dm (during five and a half growing seasons after pruning, moderate occlusion rate).
| Table 10. Proportions of discoloured knot samples and mean spreading distances of stemwood discolouration (with standard deviations, SD) for different pruning treatments. The results are presented for living, dead, and all branches five to six growing seasons after pruning based on measurements from the images of split knots (N = 1585). Some samples were rejected due to large colour defects in the stemwood caused by unknown defects. | ||||||||
| Pruning method | Pruning date | Discoloured, % of samples | Mean spreading distance (SD), mm | Reject samples | ||||
| Living | Dead | All | Living | Dead | All | |||
| Secateurs | 19.3. | 31.7 | 48.5 | 43.6 | 40.6 (28.2) | 35.2 (20.8) | 36.3 (22.4) | 6 |
| Saw | 19.3. | 44.4 | 45.2 | 45.0 | 30.5 (23.0) | 26.1 (23.4) | 27.6 (23.1) | 10 |
| Secateurs | 29.4. | 14.7 | 32.2 | 22.8 | 41.1 (28.9) | 22.5 (19.4) | 28.9 (24.3) | 2 |
| Secateurs | 3.6. | 15.4 | 44.2 | 26.9 | 15.0 (9.2) | 13.5 (9.4) | 14.0 (9.2) | 1 |
| Secateurs | 23.6. | 14.5 | 47.8 | 32.8 | 16.3 (16.4) | 32.8 (23.9) | 29.5 (23.3) | 6 |
| Secateurs | 15.7. | 16.7 | 44.6 | 31.9 | 18.8 (11.8) | 15.2 (14.3) | 16.1 (13.6) | 0 |
| Saw | 15.7. | 22.1 | 48.2 | 33.9 | 15.5 (13.3) | 17.8 (13.5) | 17.0 (13.3) | 1 |
| Secateurs | 5.8. | 20.9 | 51.7 | 35.2 | 19.1 (20.8) | 26.0 (16.4) | 23.8 (18.0) | 0 |
| Secateurs | 26.8. | 10.0 | 40.0 | 24.2 | 22.8 (29.6) | 19.8 (13.4) | 20.5 (17.3) | 4 |
| Saw | 26.8. | 35.3 | 40.8 | 39.0 | 22.7 (21.6) | 24.6 (23.4) | 24.1 (22.6) | 9 |
| Secateurs | 16.9. | 37.2 | 72.5 | 58.9 | 15.4 (11.9) | 25.1 (20.0) | 22.8 (18.8) | 11 |
| Stick 1) | autumn 2004 | - | 36.8 | - | - | 19.7 (17.0) | - | 2 |
| Stick 1) | spring 2005 | - | 27.1 | - | - | 16.9 (14.1) | - | 0 |
| Control | not pruned | 19.4 | 22.5 | 21.6 | 32.8 (13.3) | 21.1 (17.0) | 24.4 (16.7) | 0 |
| ALL | 21.7 | 42.6 | 34.3 | 23.8 (21.2) | 23.8 (18.1) | 23.8 (19.9) | 52 | |
| 1) Living branches were not removed in stick pruning. | ||||||||