| Table 1. Characteristics of the study sites – tree stand and soil parameters. | |||||||
| Parameter | Site | N obs. | Mean | Min | Max | Stdev | CV, % |
| Tree stand volume, m3 ha–1 in 2000, pre-harvest | 1 | 1 | 331.2 | ||||
| 2 | 1 | 233.7 | |||||
| 3 | 1 | 179.0 | |||||
| Tree stand basal area, m3 ha–1 in 2000, pre-harvest | 1 | 1 | 32.2 | ||||
| 2 | 1 | 26.6 | |||||
| 3 | 1 | 19.0 | |||||
| Soil organic layer thickness at sampling time in 2016, cm data by S. Tatsumi, unpublished | 1 | 3 | 3.5 | 3.0 | 4.5 | 0.85 | 24 |
| 2 | 6 | 2.5 | 1.5 | 4.0 | 1.05 | 42 | |
| 3 | 6 | 4.2 | 2.5 | 8.0 | 2.18 | 53 | |
| Soil organic layer thickness after burning and harvest in 2001, cm (data published in Laamanen 2002) | 1 | 191 | 2.4 | 0 | 7.5 | 1.25 | 52 |
| 2 | 152 | 2.9 | 0.3 | 7.6 | 1.35 | 46 | |
| 3 | 198 | 3.3 | 0.4 | 8.5 | 1.55 | 47 | |
| Soil organic layer pHH2O at sampling time in 2016, data by S. Tatsumi, unpublished | 1 | 3 | 4.6 | 4.4 | 4.8 | 0.20 | 4 |
| 2 | 6 | 4.5 | 4.0 | 5.0 | 0.38 | 8 | |
| 3 | 6 | 4.6 | 4.3 | 5.0 | 0.32 | 7 | |
| Soil organic layer water content when burying the tea bags in 2016, percent of dry soil weight (Tatsumi, unpublished) | 1 | 3 | 92 | 62 | 140 | 42 | 45 |
| 2 | 6 | 130 | 29 | 212 | 72 | 56 | |
| 3 | 6 | 157 | 65 | 335 | 116 | 74 | |
| N obs. – total number of observations for parameter per site, Mean – sample arithmetic mean, Min – sample minimum value, Max – sample maximum value, Stdev – sample standard deviation, CV, % – coefficient of variance. All the study sites (1,2,3) were burned clearcut sites with 50 m3 ha–1 green tree retention, treatments executed in 2001. Approximate coordinates (with spatial accuracy of ca. 10 km) of the study sites´ locations (based on EUREF-FIN coordinate reference system): Site 1 – 63°18´N, 30°30´E, Site 2 – 63°20´N, 30°39´E, Site 3 – 63°16´N, 30°48´E. Soil organic layer thickness after burning and harvest in 2001 based on Laamanen J. (2002). Tulen voimakkuuden vaikutus metsikön pienalaiseen vaihteluun. [The effect of fire severity on small-scale spatial heterogeneity in forest stands]. MSc thesis. University of Joensuu, Faculty of Forest Sciences, Finland. 44 p. + 12 app. | |||||||
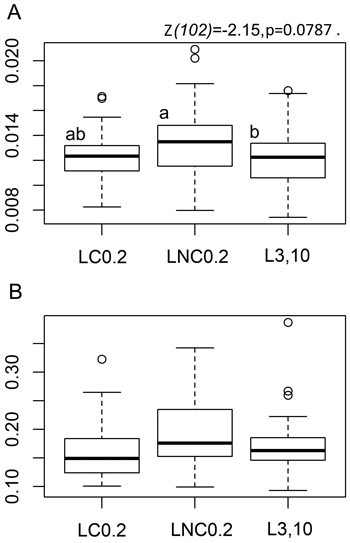
Fig. 1. Tea bag parameter boxplots by position with respect to logs. A: Boxplots for rooibos teabag litter decomposition rate constant - ‘k’ parameter, B: Boxplots for the stabilisation factor showing the inhibiting effect of environmental conditions on the decomposition of the labile fraction of green tea litter - ‘S’ parameter. LC0.2 = position next to charred logs, 0.2 m from log-ground contact zone, LNC0.2 = position next to non-charred logs, 0.2 m from log-ground contact zone, L3,10 = position away from logs, 3 or 10 m to the nearest downed log. Lower case letters denote pairwise differences between the positions based on post-hoc Tukey multiple comparison t-tests. The boxplots show aggregated data from three replicate forest sites used in the study, 40 sample plots in each of the three sites (20 near logs and 20 further away from logs) with one green tea bag and one rooibos bag per sample plot. Tea-bag incubation time in the field was 79–80 days.
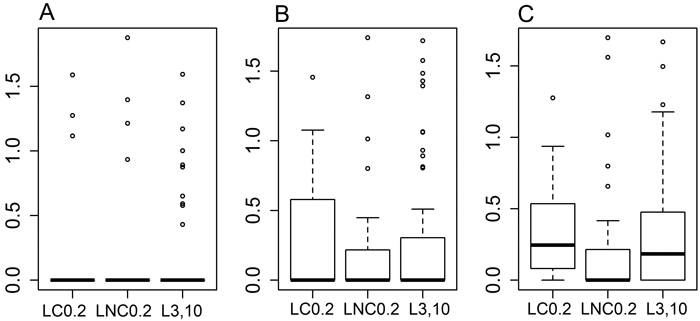
Fig. 2. Boxplots for the proportion of cellulose mass (%) remaining in the decomposition bags, data transformed into decimal logarithms. A: bags with mesh size of 1 mm, B: bags with mesh size of 50 μm, C: bags with mesh size of 1 μm. LC0.2 = position next to charred logs, 0.2 m from log-ground contact zone, LNC0.2 = position next to non-charred logs, 0.2 m from log-ground contact zone, L3,10 = position away from logs, 3 or 10 m to the nearest downed log. The boxplots show aggregated data from three replicate forest sites used in the study, where cellulose bags were buried in each forest site at 40 sample plots (20 near logs and 20 further away from logs), three bags per plot – one of each mesh size. Cellulose incubation time in the field was ca. 14 months.