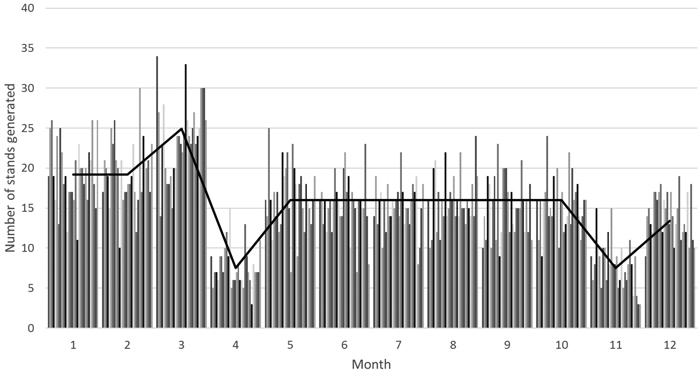
Fig. 1. Number of stands created per month in 30 repetitions (line: statistical average).
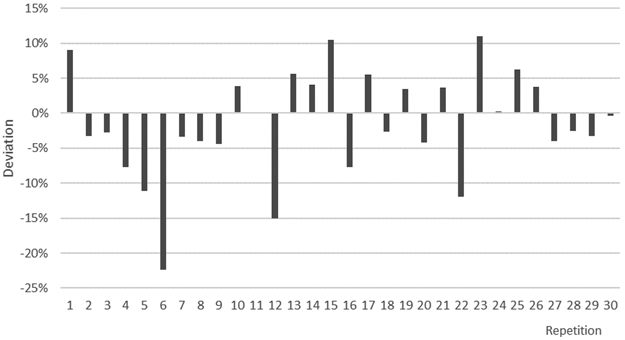
Fig. 2. Deviation of simulated biomass harvest volumes per simulation repetitions from the annual average of the total stand population.
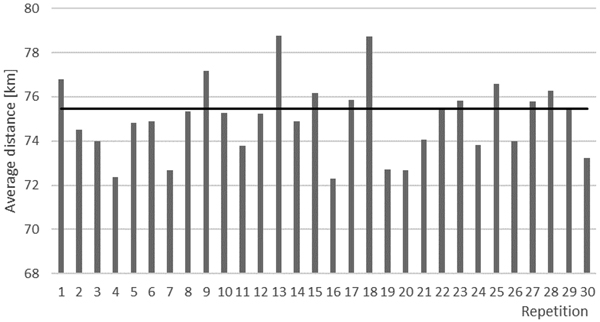
Fig. 3. Averages of simulated transport distances per simulation repetition (bars) and the average distance from all stands to the demand point (line).
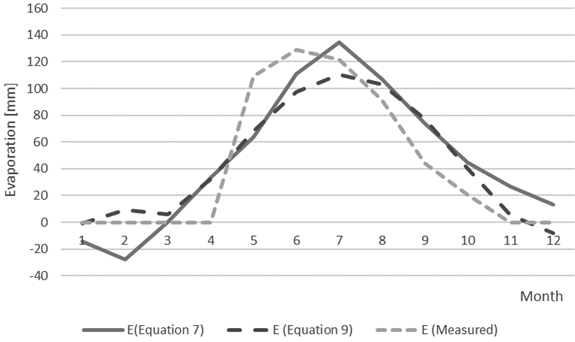
Fig. 4. Estimated evaporations and measured evaporation from the Mikkeli weather station. Equation 7: Simplified Penman-Monteith. Equation 9: VTT equation.
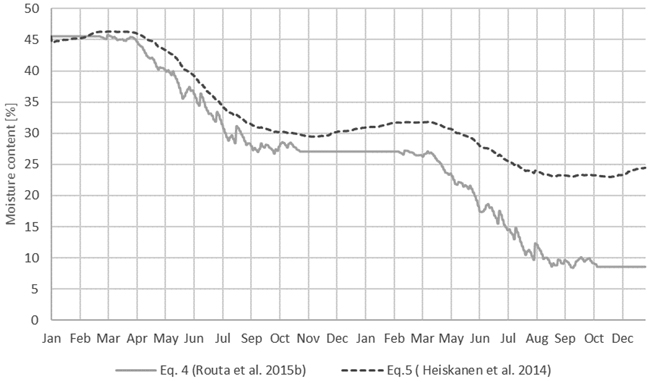
Fig. 5. Moisture content estimations with Eq. 4 (Routa et al. 2015b) and Eq. 5 (Heiskanen et al. 2014) using 2011 weather data from the Mikkeli weather station and the starting moisture 45%.