| Table 1. N fertilizer application intervals for the N treatments at Hagfors. The dosage is shown as kg N ha–1. | ||||
| Year | Treatment | |||
| 0N | 450N | 900N | 1800N b) | |
| 1981 | - | 150 | 150 | 150 |
| 1983 | - | - | - | 150 |
| 1985 | - | - | 150 | 150 |
| 1987 | - | - | - | 150 |
| 1989 | - | 150 | 150 | 150 |
| 1991 a) | - | - | - | 150 |
| 1993 a) | - | - | 150 | 150 |
| 1995 a) | - | - | - | 150 |
| 1997 a) | - | 150 | 150 | 150 |
| 1999 a) | - | - | - | 150 |
| 2001 a) | - | - | 150 | 150 |
| 2003 a) | - | - | - | 150 |
| a) Dolomite was added to the fertilizer, which then contained 27% N, 5% Ca, 2% Mg and 0.2% B. b) At the first five applications, the three 1800N plots received different amounts of other nutrients (0 up to 10 kg per nutrient), see Ring et al. (2011) for more details. | ||||
| Table 2. N fertilizer application intervals for the different treatments at Nissafors. The dosage is shown as kg N ha–1. | ||
| Year | Treatment | |
| 0N | 450N | |
| 1977 | - | 75 (block 1 and 2), 6x25 (block 3) |
| 1978 | - | 75 (block 1 and 2) |
| 1984 | - | 150 |
| 1989 a) | - | 150 |
| a) In addition, 20 kg P ha–1 was applied. | ||
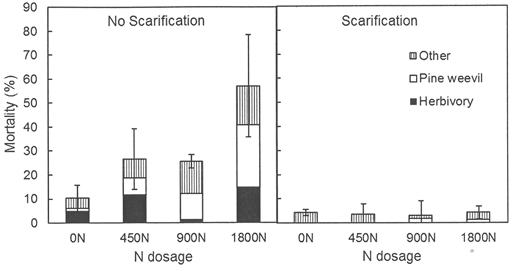
Fig. 1. Mortality (% dead seedlings) for seedlings planted in sub-plots with and without scarification at Hagfors five years after planting. Three types of damage were distinguished: damage caused by pine weevils, damage caused by herbivory, and damage caused by unknown factors. 0N, 450N, 900N and 1800N denote the applied total N dosage (in kg ha–1).
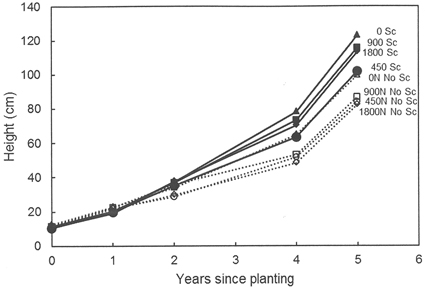
Fig. 2. Height development (mm) for seedlings grown in the different treatment combinations at Hagfors. 0N, 450N, 900N and 1800N denote the applied N dosage (in kg ha–1). No Sc = no scarification; Sc = scarification (disc trenching).
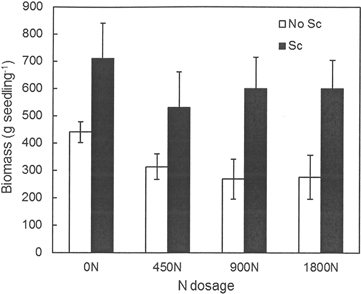
Fig. 3. Aboveground biomass (g dry weight per seedling) for seedlings grown in the different treatment combinations at Hagfors. 0N, 450N, 900N and 1800N denote the applied N dosage (in kg ha–1). No Sc = no scarification; Sc = scarification (disc trenching).
| Table 3. Results obtained in the analyses of the different response variables, shown in terms of the p-values for each treatment effect and site. | ||||||
| Site | Treatment | Variable | ||||
| Mortality | Damage | Height | Diameter | Biomass | ||
| Hagfors | Fertilization | 0.813 | 0.682 | 0.337 | 0.654 | 0.591 |
| Scarification | <0.001 | <0.001 | <0.001 | <0.001 | <0.001 | |
| Fert. * Scar. | <0.001 | <0.001 | 0.291 | 0.275 | 0.682 | |
| Nissafors | Fertilization | 0.620 | 0.577 | 0.659 | ||
| Scarification | <0.001 | 0.002 | 0.002 | |||
| Fert. * Scar. | 0.140 | 0.883 | 0.486 | |||
| Table 4. Concentrations of Al, Ca, K, Mg, Mn, P and S (mg g–1) and B, Cu, Fe, Na and Zn (μg g–1) in the needles of seedlings grown in different treatments at Hagfors and p-values for fertilization, scarification and their interaction according to Eq. 3. Needles were sampled five years after planting. No Sc = no scarification and Sc = scarification. | |||||||||||
| Element | p-values | Treatments | |||||||||
| Fert. | Scar. | Fert.*Scar. | 0N | 450N | 900N | 1800N | |||||
| No Sc | Sc | No Sc | Sc | No Sc | Sc | No Sc | Sc | ||||
| Al | 0.180 | 0.015 | 0.677 | 0.24 | 0.27 | 0.26 | 0.32 | 0.22 | 0.33 | 0.23 | 0.30 |
| B | 0.001 | 0.001 | 0.075 | 3.67 | 5.00 | 7.67 | 9.33 | 8.33 | 13.7 | 14.0 | 19.0 |
| Ca | 0.411 | 0.115 | 0.671 | 1.85 | 2.28 | 1.90 | 2.23 | 1.72 | 2.19 | 2.37 | 2.24 |
| Cu | 0.213 | 0.456 | 0.885 | 1.67 | 2.00 | 1.67 | 2.00 | 2.33 | 2.33 | 2.00 | 2.00 |
| Fe | 0.147 | 0.947 | 0.308 | 29.7 | 30.0 | 60.0 | 36.0 | 29.3 | 36.0 | 42.0 | 49.7 |
| K | 0.243 | 0.367 | 0.376 | 2.84 | 3.07 | 3.31 | 3.18 | 2.89 | 3.49 | 2.69 | 2.63 |
| Mg | 0.025 | 0.153 | 0.743 | 0.50 | 0.50 | 0.58 | 0.48 | 0.66 | 0.61 | 0.66 | 0.56 |
| Mn | 0.134 | 0.010 | 0.820 | 0.38 | 0.44 | 0.41 | 0.50 | 0.31 | 0.43 | 0.41 | 0.52 |
| Na | 0.685 | 0.237 | 0.009 | 29.3 | 24.7 | 30.3 | 24.0 | 24.3 | 33.0 | 31.5 | 29.0 |
| P | 0.758 | 0.479 | 0.148 | 0.81 | 0.83 | 0.87 | 0.83 | 0.79 | 0.94 | 0.93 | 0.87 |
| S | 0.453 | 0.800 | 0.252 | 0.54 | 0.54 | 0.61 | 0.57 | 0.53 | 0.62 | 0.68 | 0.58 |
| Zn | 0.472 | 0.306 | 0.492 | 35.0 | 33.7 | 40.7 | 34.7 | 93.3 | 34.7 | 40.5 | 38.0 |
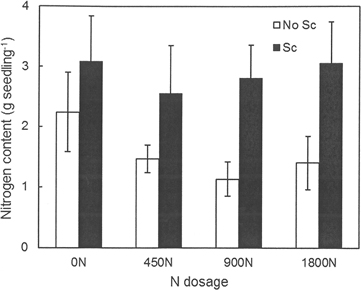
Fig. 4. Nitrogen content (g per seedling) in seedlings grown in the different treatment combinations at Hagfors. 0N, 450N, 900N and 1800N denote the applied N dosage (in kg ha–1). No Sc = no scarification; Sc = scarification (disc trenching).
| Table 5. The ratios of the P, K, Ca, Mg and S concentrations to the N concentration in the needles of the seedlings grown at Hagfors in different treatments. Values followed by different letters within the same rows are significantly different. No Sc = no scarification and Sc = scarification. | ||||||||
| Ratio | Treatments | |||||||
| 0N | 450N | 900N | 1800N | |||||
| No Sc | Sc | No Sc | Sc | No Sc | Sc | No Sc | Sc | |
| P:N | 0.10a | 0.10a | 0.10a | 0.10a | 0.10a | 0.12b | 0.10a | 0.10a |
| K:N | 0.35ac | 0.38ab | 0.38ab | 0.37ac | 0.38abc | 0.44b | 0.29c | 0.31ac |
| Ca:N | 0.22 | 0.28 | 0.22 | 0.26 | 0.22 | 0.28 | 0.25 | 0.27 |
| Mg:N | 0.06ab | 0.06ab | 0.07ab | 0.06a | 0.09b | 0.08ab | 0.07ab | 0.07ab |
| S:N | 0.07a | 0.07a | 0.07a | 0.07a | 0.07a | 0.08b | 0.07ab | 0.07a |
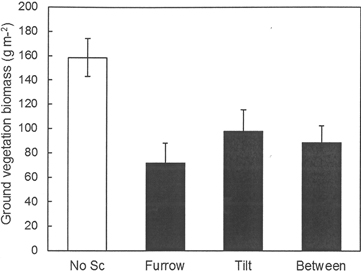
Fig. 5. Biomass of ground vegetation (g m–2) in the different scarification treatments at Hagfors. For the plots without scarification the overall mean value is shown. In the disc trenched treatment (scarification), mean values are shown for the furrow, the tilt and the area between furrows.
| Table 6. Summary of the results of the statistical analysis, shown as p-values, and the weight and chemical contents of the ground vegetation for each treatment at Hagfors (area-weighted values). The contents are given in g m–2 (for weight, C, N, Ca, K, Mg, Mn, P and S) or mg m–2 (for Al, B, Cu, Fe, Na and Zn). Values followed by different letters within the same rows are significantly different. | ||||||||||
| p-values | Treatments | |||||||||
| Fert. | Scar. | Fert.*Scar. | 0N | 450N | 900N | 1800N | No Sc | Sc | ||
| Weight | 0.425 | 0.006 | 0.901 | 112.2 | 97.6 | 132.6 | 147.8 | 158.6a | 86.49b | |
| C | 0.535 | 0.007 | 0.960 | 57.37 | 50.25 | 68.38 | 71.28 | 79.71a | 43.93b | |
| N | 0.278 | 0.003 | 0.707 | 1.227 | 1.250 | 1.589 | 1.871 | 1.943a | 1.025b | |
| Al | 0.217 | 0.058 | 0.921 | 19.47 | 19.82 | 20.82 | 11.13 | 21.38 | 14.23 | |
| B | 0.489 | 0.144 | 0.942 | 1.596 | 1.679 | 2.251 | 2.302 | 2.268 | 1.646 | |
| Ca | 0.331 | 0.006 | 0.894 | 0.800 | 0.713 | 0.938 | 0.551 | 0.989a | 0.512b | |
| Cu | 0.404 | 0.015 | 0.990 | 0.548 | 0.452 | 0.665 | 0.515 | 0.667a | 0.424b | |
| Fe | 0.962 | 0.766 | 0.698 | 8.129 | 8.895 | 7.604 | 8.037 | 8.431 | 7.902 | |
| K | 0.005 | 0.011 | 0.068 | 0.550b | 0.503b | 0.684b | 1.183a | 0.977a | 0.483b | |
| Mg | 0.356 | 0.006 | 0.985 | 0.137 | 0.125 | 0.181 | 0.175 | 0.197a | 0.113b | |
| Mn | 0.923 | 0.037 | 0.906 | 0.119 | 0.101 | 0.119 | 0.111 | 0.140a | 0.086b | |
| Na | 0.279 | 0.545 | 0.840 | 2.767 | 3.872 | 2.964 | 5.041 | 3.931 | 3.391 | |
| P | 0.266 | 0.016 | 0.648 | 0.139 | 0.133 | 0.171 | 0.205 | 0.216a | 0.108b | |
| S | 0.510 | 0.007 | 0.967 | 0.115 | 0.106 | 0.145 | 0.146 | 0.163a | 0.092b | |
| Zn | 0.705 | 0.003 | 0.937 | 3.818 | 3.239 | 4.399 | 4.018 | 5.143a | 2.596b | |