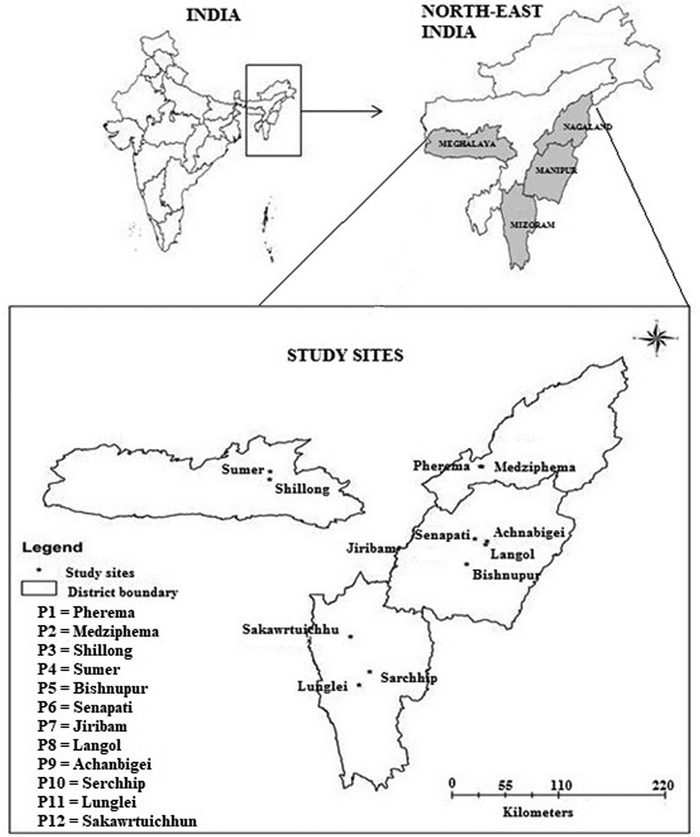
Fig. 1. Map of study area showing different provenances of Parkia timoriana.
| Table 1. Geomorphological climatic data corresponding to each provenance of Parkia timoriana in Northeast India. Meteorology data is from the Indian Meteorological Department (IMD) sub-stations, Krishi Vigyan Kendra (KVK) stations and state statistical department of the respective states. | |||||||
| Provenance | Code | District | Latitude | Longitude | Altitude (m) | MAP (mm) | MAT (°C) |
| Pherema | P1 | Dimapur | 25°45´21´´N | 93°53´39´´E | 432 | 3224 | 24 |
| Medziphema | P2 | Dimapur | 25°45´30´´N | 93°52´30´´E | 466 | 1180 | 28 |
| Shillong | P3 | Shillong | 25°35´80´´N | 91°55´21´´E | 1429.5 | 3530 | 17 |
| Sumer | P4 | Ri-Bhoi | 25°41´50´´N | 91°54´99´´E | 849.5 | 3063 | 22 |
| Bishnupur | P5 | Bishnupur | 24°36´34´´N | 93°45´05´´E | 820 | 1237 | 21 |
| Senapati | P6 | Senapati | 24°54´25´´N | 93°49´36´´E | 886 | 1537 | 22 |
| Jiribam | P7 | Jiribam | 24°47´15´´N | 93°06´56´´E | 60 | 1942 | 29 |
| Langol | P8 | ImphalWest | 24°50´25´´N | 93°55´39´´E | 851 | 1482 | 21 |
| Achanbigei | P9 | Imphal East | 24°52´46´´N | 93°56´25´´E | 788 | 1591 | 24 |
| Serchhip | P10 | Serchhip | 23°20´46´´N | 92°51´02´´E | 858.5 | 2208 | 25 |
| Lunglei | P11 | Lunglei | 23°11´26´´N | 92°45´06´´E | 809 | 3080 | 26 |
| Sakawrtuichhun | P12 | Aizawl | 23°45´33´´N | 92°40´25´´E | 839 | 2548 | 25 |
| MAP = Mean annual precipitation, MAT = Mean annual temperature. | |||||||
| Table 2. Tree characters corresponding to average candidate plus tree (CPT) of each provenance of Parkia timoriana. | ||||||||
| Provenance | HT | DBH | CS | V | NB | CB | PC | PT |
| P1 | 11.45 | 19.78 | 5.87 | 0.47 | 9.3 | 5.01 | 10.4 | 492.1 |
| P2 | 13.10 | 23.28 | 6.08 | 0.71 | 7.1 | 4.15 | 9.3 | 268.8 |
| P3 | 10.30 | 21.85 | 5.93 | 0.55 | 9.4 | 4.50 | 10.3 | 424.7 |
| P4 | 13.50 | 25.30 | 6.24 | 0.91 | 9.9 | 4.88 | 9.5 | 457.8 |
| P5 | 11.30 | 16.50 | 6.12 | 0.49 | 8.8 | 4.87 | 13.0 | 541.8 |
| P6 | 10.40 | 18.15 | 5.84 | 0.54 | 7.7 | 4.50 | 10.4 | 360.6 |
| P7 | 12.30 | 22.70 | 5.65 | 0.67 | 11.0 | 4.09 | 9.4 | 414.4 |
| P8 | 6.73 | 16.05 | 5.03 | 0.22 | 6.9 | 5.01 | 11.6 | 403.2 |
| P9 | 13.50 | 18.86 | 5.60 | 0.56 | 7.9 | 4.63 | 10.2 | 369.0 |
| P10 | 13.40 | 20.08 | 6.63 | 0.63 | 10.0 | 4.84 | 12.5 | 609.6 |
| P11 | 9.10 | 17.45 | 5.55 | 0.34 | 6.4 | 4.55 | 8.9 | 260.8 |
| P12 | 11.80 | 22.60 | 6.21 | 0.89 | 9.8 | 4.87 | 9.2 | 447.6 |
| LSM | 11.41 | 20.22 | 5.90 | 0.58 | 8.7 | 4.66 | 10.4 | 420.8 |
| CV | 17.93 | 14.53 | 6.98 | 34.49 | 16.73 | 6.64 | 12.77 | 24.07 |
| SEm | 0.59 | 0.85 | 0.12 | 0.02 | 0.42 | 0.09 | 0.38 | 29.2 |
| LSD (P < 0.05) | 2.01 | 5.34 | 0.70 | 0.72 | 2.16 | 0.70 | 1.2 | 133.7 |
| HT = tree height (m), DBH = diameter at breast height (cm), CS = Crown spread (m), V = tree volume (m3), NB = number of branches per tree, CB = number of capitulum per branch, PC = number of pods per capitulum, PT = number of pods per tree, LSM = Least Square Means, CV = coefficient of variance, SEm = standard error of mean, LSD = least significant difference, n = 10. | ||||||||
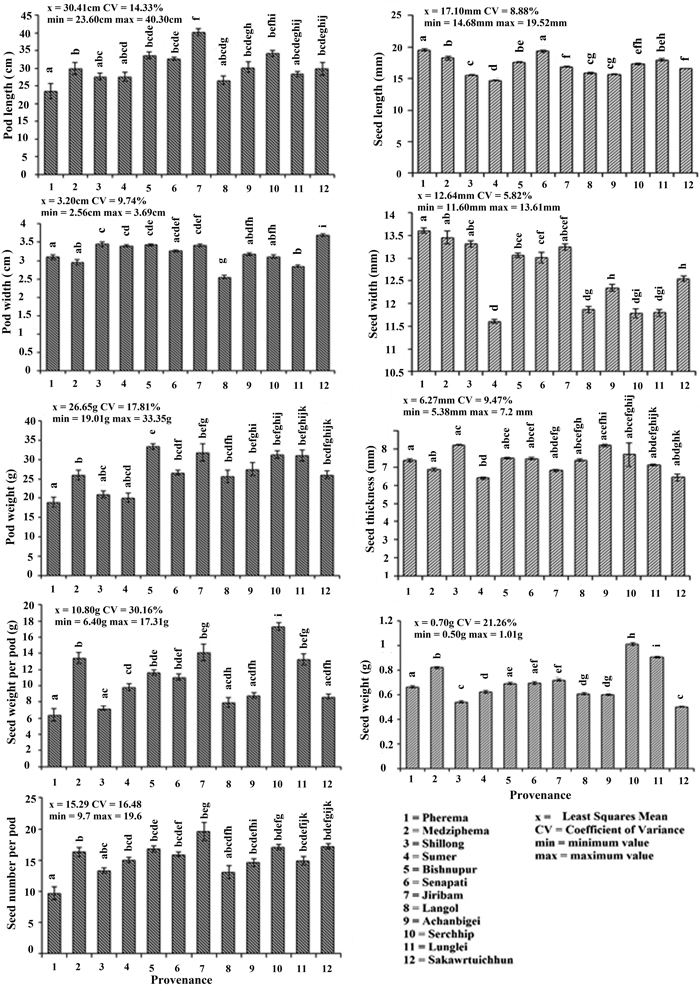
Fig. 2. Morphometric characters of Parkia timoriana in 12 provenances. Tukey’s post hoc test was used for pairwise separations. The values with same letter between the provenances are not significantly different at P < 0.05. View larger in new window/tab.
| Table 3. Pearson’s correlation coefficient between seed and pod morphometric traits (SPT’s) of 12 Parkia timoriana provenances. | ||||||||||
| SPT | PL | PWT | SWP | SNP | GP | GE | SDL1 | CD1 | SDL2 | CD2 |
| SWT | 0.31 | 0.53 | 0.86** | 0.27 | 0.55 | 0.52 | 0.58* | 0.09 | 0.51 | 0.12 |
| PL | 1 | 0.76** | 0.70* | 0.89** | –0.07 | –0.10 | 0.54 | –0.04 | 0.48 | 0.08 |
| PWT | 1 | 0.73** | 0.72** | –0.09 | –0.16 | 0.59* | 0.15 | 0.51 | 0.21 | |
| SWP | 1 | 0.72** | 0.34 | 0.31 | 0.76** | 0.04 | 0.69* | 0.06 | ||
| SNP | 1 | –0.10 | –0.13 | 0.64* | –0.05 | 0.58* | –0.04 | |||
| GP | 1 | 0.99** | 0.23 | 0.34 | 0.14 | 0.48 | ||||
| GE | 1 | 0.18 | 0.26 | 0.09 | 0.44 | |||||
| SDL1 | 1 | 0.12 | 0.97** | 0.19 | ||||||
| CD1 | 1 | 0.13 | 0.78** | |||||||
| SDL2 | 1 | 0.15 | ||||||||
| CD2 | 1 | |||||||||
| * Correlation is significant at P < 0.05 (2 tailed). ** Correlation is significant at P < 0.01 (2 tailed). SWT = seed weight, PL = pod length, PWT = pod weight, SWP = seed weight per pod, SNP = seed number, GP = Germination percentage, GE = Germination energy, SDL1 and CD1 = seedling length and collar diameter at 90 days, SDL2 and CD2 = seedling length and collar diameter at 180 days. Seed length (SL), seed width (SW), seed thickness (ST) and pod width (PW) are not included as they have no significant relationship to any of the traits. | ||||||||||
| Table 4. Pearson correlation analysis showing the effect of seasonal distribution of rainfall and temperature and geography of provenance of Parkia timoriana on the seed and pod traits. | ||||||||||
| WR | MR | PMR | WT | STM | MT | PMT | LAT | LON | ALT | |
| PL | –0.42* | –0.36* | –0.23 | 0.20 | 0.28 | 0.24 | 0.32* | –0.24 | 0.03 | –0.29 |
| PW | –0.48* | 0.12 | 0.12 | –0.10 | –0.11 | –0.19 | –0.10 | 0.05 | –0.42* | 0.09 |
| PWT | –0.22 | –0.43* | –0.14 | 0.08 | 0.29 | 0.28 | 0.29 | –0.52* | 0.18 | –0.19 |
| SWP | –0.46* | –0.27 | –0.40* | 0.39* | 0.53* | 0.41* | 0.48* | –0.46* | –0.03 | –0.28 |
| SNP | –0.51* | –0.34* | –0.26 | 0.23 | 0.31* | 0.26 | 0.35* | –0.31* | –0.10 | –0.21 |
| SL | 0.38* | –0.21 | –0.16 | 0.23 | 0.34* | 0.36* | 0.28 | –0.07 | 0.52* | –0.35* |
| SW | 0.30* | –0.10 | –0.22 | –0.01 | 0.05 | 0.13 | 0.08 | 0.50* | 0.31* | –0.27 |
| ST | 0.09 | 0.00 | 0.31* | –0.30* | –0.29 | –0.30* | –0.36* | 0.03 | 0.152 | 0.32* |
| SWT | –0.18 | –0.10 | –0.34* | 0.40* | 0.56* | 0.42* | 0.43* | –0.47* | 0.087 | –0.25 |
| *Correlation is significant at P < 0.01 (2 tailed). PL = pod length, PW = pod width, PWT = pod weight, SWP = seed weight per pod, SNP = seed number per pod, SL = seed length, SW = seed width, ST = seed thickness, SWT = seed weight, WR = winter rainfall, SR = summer rainfall, MR = monsoon rainfall, PMR = post monsoon rainfall, WT = winter temperature, STM = summer temperature, PMT = post monsoon temperature, LAT = latitude, LON = longitude, ALT = altitude. Summer rainfall (SR) is not included as it has no significant correlation. | ||||||||||
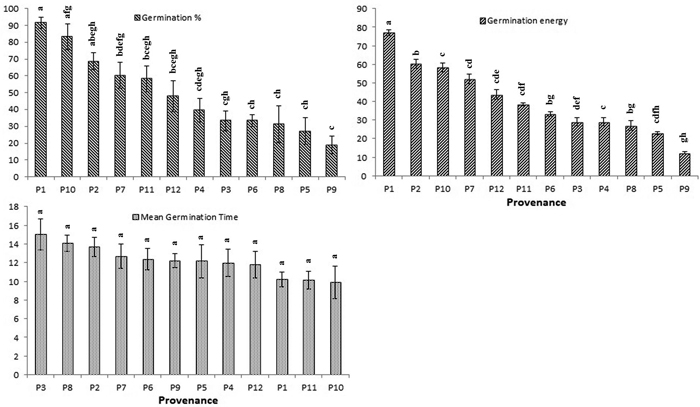
Fig. 3. Effect of different provenance on germination percentage (GP), germination energy (GE) and mean germination time (MGT) of Parkia timoriana. Tukey’s post hoc test was used for pairwise separations. The values with same letter between the provenances are not significantly different at P < 0.05. View larger in new window/tab.
| Table 5. Variance component analysis of seed germination and seedling growth traits of Parkia timoriana. | ||||||
| Source of variation | df | Variance components | Expected mean square | |||
| Germination traits | GP | GE | ||||
| Provenance | 11 | 0.067* | 0.035* | |||
| Error | 48 | 0.021 | 0.013 | |||
| Growth traits | SDL1 | CD1 | SDL2 | CD2 | ||
| Provenance | 11 | 24* | 0.11* | 192.676* | 0.688* | |
| Error | 288 | 38 | 0.032 | 120.113 | 0.141 | |
| df = degree of freedom, GP = germination per cent, GE = germination energy, SDL1 and CD1 = seedling length and collar diameter at 90 days, SDL2 and CD2 = seedling length and collar diameter at 180 days. *Significant at P < 0.05. | ||||||
| Table 6. Broad sense heritability, provenance and environment coefficient of variation for germination and growth characters of Parkia timoriana. | |||
| Characters | Coefficient of variation (%) | Heritability (%) | |
| Provenance | Environment | ||
| Germination Parameters | |||
| GP% | 1.36 | 0.43 | 76.0 |
| GE% | 0.85 | 0.32 | 72.0 |
| Seedling growth parameters | |||
| SDL1 | 8.11 | 10.21 | 38.7 |
| CD1 | 6.98 | 3.77 | 77.5 |
| SDL2 | 13.37 | 10.56 | 61.6 |
| CD2 | 12.39 | 5.61 | 83.0 |
| GP = germination per cent, GE = germination energy, SDL1 and CD1 = seedling length and collar diameter at 90 days, SDL2 and CD2 = seedling length and collar diameter at 180 days. | |||
| Table 7. Seedling growth parameters of Parkia timoriana as affected by different seed sources in Northeast India. | ||||||||
| Provenance/Seed source | Seedling growth parameters | |||||||
| SDL1 ± SEm | CD1 ± SEm | SV1 | SDL2 ± SEm | CD2 ± SEm | SV2 | VI | AGR | |
| P1 | 47.75 ± 0.6 | 5.27 ± 0.04 | 4345.1 | 76.4 ± 0.87 | 7.89 ± 0.05 | 6952.1 | HV | 0.32 |
| P2 | 64.52 ± 1.28 | 4.69 ± 0.02 | 4387.6 | 111.79 ± 2.22 | 6.65 ± 0.03 | 7601.6 | HV | 0.53 |
| P3 | 56.74 ± 1.27 | 4.58 ± 0.02 | 1872.4 | 102.52 ± 20 | 5.62 ± 0.03 | 3383.3 | LV | 0.51 |
| P4 | 56.98 ± 1.15 | 4.33 ± 0.03 | 2279.2 | 100.37 ± 2.22 | 5.86 ± 0.04 | 4014.6 | LV | 0.48 |
| P5 | 53.3 ± 1.1 | 5.01 ± 0.04 | 1385.8 | 91.37 ± 2.12 | 6.78 ± 0.06 | 2375.7 | LV | 0.42 |
| P6 | 54.68 ± 1.14 | 3.44 ± 0.03 | 1804.4 | 87.43 ± 1.52 | 5.11 ± 0.05 | 2885.2 | LV | 0.36 |
| P7 | 70.02 ± 1.97 | 4.69 ± 0.1 | 3991.1 | 120.75 ± 4.17 | 7.56 ± 0.15 | 6882.7 | HV | 0.56 |
| P8 | 62.6 ± 1.46 | 4.32 ± 0.06 | 1940.6 | 111.12 ± 2.80 | 6.94 ± 0.10 | 3444.7 | LV | 0.54 |
| P9 | 59.16 ± 0.99 | 5.45 ± 0.04 | 1064.9 | 102.11 ± 1.96 | 7.13 ± 0.13 | 1837.9 | LV | 0.48 |
| P10 | 72.04 ± 1.02 | 5.31 ± 0.09 | 5979.3 | 126.6 ± 2.01 | 7.23 ± 0.05 | 10507.5 | HV | 0.61 |
| P11 | 67.06 ± 0.82 | 4.7 ± 0.04 | 3889.5 | 113.2 ± 1.41 | 6.52 ± 0.05 | 6565.8 | HV | 0.51 |
| P12 | 61.04 ± 0.45 | 5.19 ± 0.04 | 3296.2 | 102.16 ± 1.06 | 7.04 ± 0.05 | 5516.7 | LV | 0.46 |
| Mean | 60.49 | 4.75 | 3019.7 | 103.82 | 6.69 | 5163.8 | ||
| CV | 14.79 | 12.48 | 50.08 | 16.63 | 13.23 | 50.30 | ||
| SEm | 0.52 | 0.03 | 436.6 | 0.99 | 0.05 | 749.8 | ||
| LSD (P < 0.05) | 3.72 | 0.16 | 1050.2 | 6.98 | 0.25 | 1803.7 | ||
| SDL1 = seedling length (cm) on 90th day, CD1 = collar diameter(mm) on 90th day, SDL2 = seedling length(cm) on 180th day, CD2 = collar diameter(mm) on 180th day, SV = seedling vigour, VI = vigour index, HV = high vigour, LV = low vigour, AGR = Average growth rate (cm/day), SEm = standard error of mean. | ||||||||
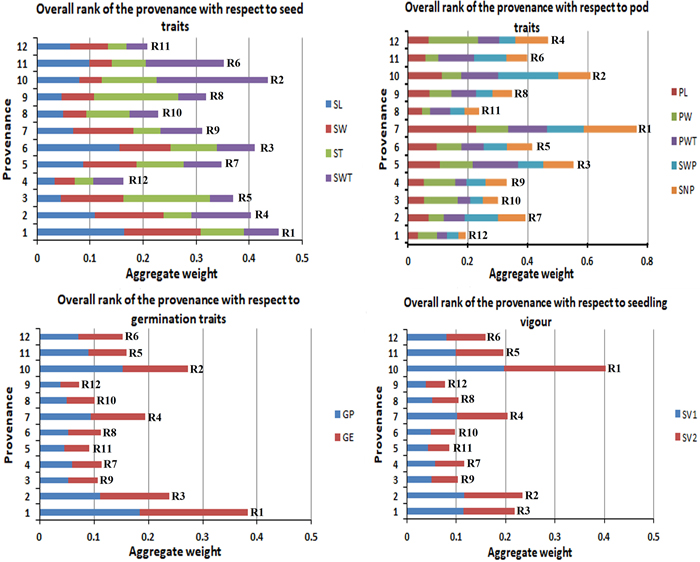
Fig. 4. Overall rank of the provenances with respect to their morphological (seed and pod), germination percentage and seedling vigour.R1 to R12 are the aggregate rank of traits.