| Table 1. Result of Paired samples t-test for quantity of evergreen and deciduous trees between 1996 and 2017, in Tianmu Mountains, eastern China. | |||||
| Life forms | mean | se | t | df | p |
| Evergreen1996 – Evergreen2017 | –6.56 | 1.41 | –4.65 | 24 | 0.00 |
| Deciduous1996 – Deciduous2017 | 0.96 | 0.35 | 2.75 | 24 | 0.01 |
| Table 2. Changes of the evergreen and deciduous species in Tianmu Mountains, eastern China, in 1996 and 2017. | |||||||||||
| Life forms | Stem density (stems ha–1) | Basal area (m2 ha–1) | IV | Recruit trees | Dead trees | Survival trees | Recruitment rate | Mortality rate | |||
| 1996 | 2017 | 1996 | 2017 | 1996 | 2017 | 1996–2017 | 1996–2017 | 1996–2017 | 1996–2017 | 1996–2017 | |
| Evergreen | 304 | 468 | 19.80 | 21.99 | 49.22 | 56.84 | 268 | 104 | 201 | 4.0% | 1.9% |
| Deciduous | 249 | 225 | 18.36 | 17.70 | 50.78 | 43.16 | 90 | 114 | 134 | 2.5% | 2.9% |
| Total | 553 | 693 | 38.16 | 39.69 | 100 | 100 | 358 | 218 | 335 | ||
| Table 3. Diversity indices (Hill Numbers: N0, N1, N2) of the evergreen and deciduous life forms in 1996 and 2017. | ||||||
| Life forms | N0 | N1 | N2 | |||
| 1996 | 2017 | 1996 | 2017 | 1996 | 2017 | |
| Evergreen | 9 | 9 | 8.67 | 10.59 | 1.47 | 1.32 |
| Deciduous | 31 | 40 | 43.38 | 58.52 | 1.16 | 1.14 |
| Table 4. Height structure of tree layer in Tianmu Mountains, eastern China, in 1996 and 2017. | |||||||
| Layer | Life forms | Species | Trees | Net gains | Mortality | ||
| 1996 | 2017 | 1996 | 2017 | 1996–2017 | 1996–2017 | ||
| A | Evergreen | 4 | 4 | 22 | 26 | 4 | 1 |
| Deciduous | 9 | 11 | 66 | 65 | –1 | 15 | |
| B | Evergreen | 8 | 8 | 76 | 144 | 68 | 24 |
| Deciduous | 22 | 30 | 144 | 93 | 51 | 59 | |
| C | Evergreen | 7 | 8 | 206 | 298 | 92 | 79 |
| Deciduous | 24 | 26 | 69 | 67 | –2 | 40 | |
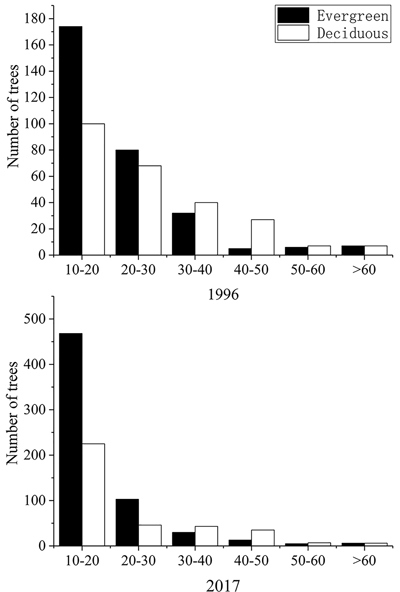
Fig. 1. Size distribution of the evergreen and deciduous trees. in Tianmu Mountains, eastern China, in 1996 and 2017.
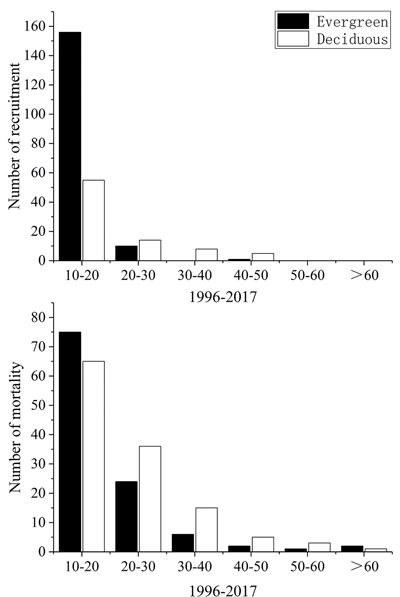
Fig. 2. Size distribution of recruits and dead trees for each life form in Tianmu Mountains, eastern China, in 1996 and 2017.
| Table 5. Floristic changes of the top ten tree species ranked by importance values, in Tianmu Mountains, eastern China, in 1996 and 2017. | ||||||||
| Species name | IV | Stem density (stems ha–1) | Mortality rate 1996–2017 | Recruitment rate 1996–2017 | Life forms | |||
| 1996 | 2017 | 1996 | 2017 | |||||
| 1 | Daphniphyllum macropodum | 3.18 | 14.65 | 15 | 177 | 5.2% | 16.9% | Evergreen |
| 2 | Cyclobalanopsis myrsinifolia (Blume) Oerst. | 17.37 | 10.86 | 153 | 118 | 2.1% | 0.8% | Deciduous |
| 3 | Cunninghamia lanceolata (Lamb.) Hook. | 8.98 | 10.08 | 64 | 64 | 0.6% | 0.6% | Evergreen |
| 4 | Cyclocarya paliurus | 13.4 | 9.69 | 80 | 56 | 3.3% | 1.6% | Deciduous |
| 5 | Liquidambar acalycina H.T. Chang | 7.66 | 7.85 | 31 | 33 | 0.0% | 0.3% | Deciduous |
| 6 | Lithocarpus brevicaudatus | 3.07 | 6.41 | 22 | 52 | 2.5% | 6.6% | Evergreen |
| 7 | Cryptomeria fortunei | 8.98 | 6.36 | 10 | 9 | 1.1% | 0.6% | Evergreen |
| 8 | Litsea auriculata S.S. Chien & W.C. Cheng | 3.53 | 3.64 | 15 | 15 | 0.7% | 0.7% | Deciduous |
| 9 | Dendrobenthamia japonica var. chinensis (Osborn) W.P.Fang | 2.66 | 3.18 | 16 | 25 | 2.7% | 4.9% | Deciduous |
| 10 | Eurya hebeclados Ling | 3.33 | 3.09 | 26 | 28 | 5.6% | 5.9% | Evergreen |
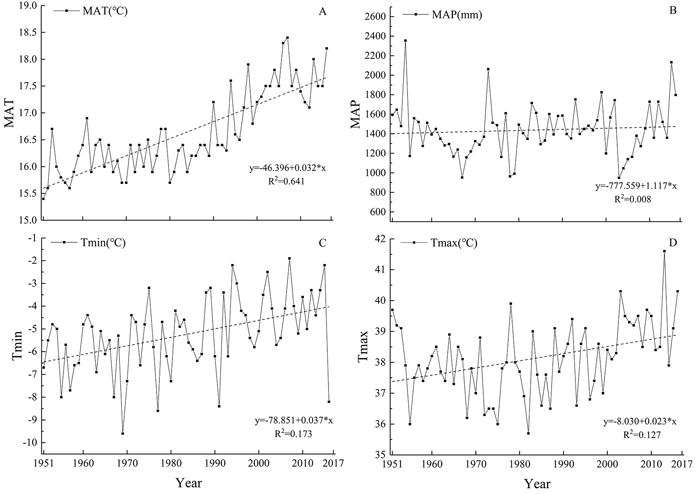
Fig. 3. Changes in annual temperature (MAT), annual precipitation (MAP), annual hottest month average temperature (Tmax) and coldest month average temperature (Tmin) of 60 years in Tianmu Mountains, eastern China. View larger in new window/tab.