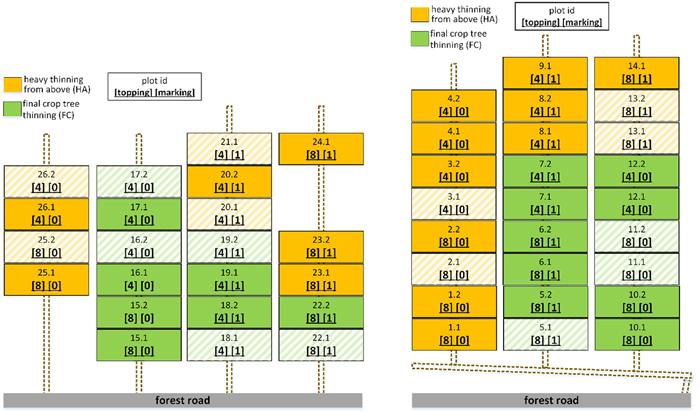
Fig. 1. Scheme of the study sites with harvested plots showing unique parcel ID, topping diameter either [8] cm or [4] cm and if marking was applied [1] or not [0]. Within green plots, final crop tree thinning was performed and in orange plots, heavy thinning from above was done. View larger in new window/tab.
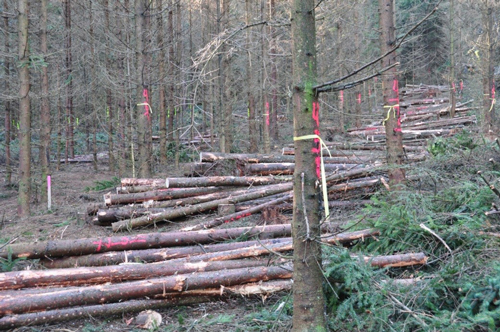
Fig. 2. Thinned plot showing marked trees that remained including pegs for marking boundaries of plots with the center of the skid trail on the right and already bucked assortments on the left.
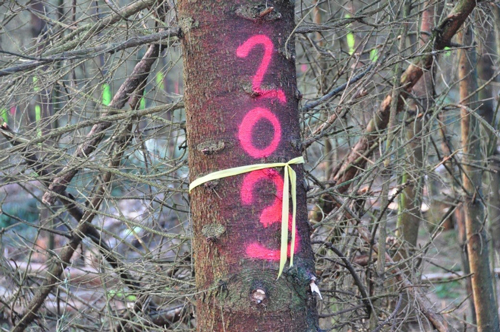
Fig. 3. Marked tree at the study site selected for remaining (yellow ribbon) with its unique identification number at breast height for postprocessing purposes and assigning stand and tree related data.
| Table 1. Description of the stand stocking on the 48 studied plots by applied thinning method – heavy thinning from above (HA) or final crop tree thinning (FC), marking and topping diameter. | ||||||||
| thinning method | marking | topping diameter (cm) | mean | std. dev. | 0.05% | 0.95% | mean | number of trees |
| dbh (cm) | dbh (cm) | dbh (cm) | dbh (cm) | stem volume (m3) over bark | ||||
| HA | yes | 4 | 14.3 | 4.5 | 8.4 | 22.4 | 0.126 | 615 |
| no | 4 | 14.4 | 4.6 | 8.3 | 22.4 | 0.128 | 600 | |
| FC | yes | 4 | 13.2 | 3.4 | 8.4 | 19.2 | 0.103 | 753 |
| no | 4 | 14.2 | 3.7 | 8.5 | 20.3 | 0.119 | 615 | |
| HA | yes | 8 | 14.7 | 4.6 | 8.4 | 23.1 | 0.135 | 592 |
| no | 8 | 13.5 | 4.2 | 8.3 | 20.8 | 0.111 | 670 | |
| FC | yes | 8 | 12.5 | 3.7 | 8.0 | 19.5 | 0.093 | 761 |
| no | 8 | 14.4 | 4.3 | 8.5 | 22.2 | 0.127 | 596 | |
| Table 2. Summary of stocking and harvested volumes including stand density and basal area for the studied 48 plots by the applied thinning method and marking treatment. | ||||||||
| thinning method | marking | topping diameter (cm) | volume | stand density | basal area | |||
| stocking (m3 ha-1) | harvested (%) | stocking (n ha-1) | harvested (%) | stocking (m2 ha-1) | harvested (%) | |||
| HA | yes | 4 | 260.2 | 71.1 | 2.034 | 80.5 | 36.3 | 72.8 |
| no | 4 | 261.2 | 48.4 | 2.077 | 62.8 | 36.5 | 51.1 | |
| FC | yes | 4 | 248.2 | 47.5 | 2.077 | 50.1 | 34.9 | 48.0 |
| no | 4 | 261.4 | 46.6 | 2.545 | 50.5 | 37.0 | 47.1 | |
| HA | yes | 8 | 246.9 | 65.1 | 2.263 | 74.4 | 35.1 | 66.4 |
| no | 8 | 270.2 | 48.0 | 2.005 | 60.3 | 37.6 | 50.1 | |
| FC | yes | 8 | 256.9 | 51.5 | 2.024 | 54.7 | 35.7 | 51.9 |
| no | 8 | 233.3 | 45.6 | 2.563 | 49.6 | 34.0 | 46.2 | |
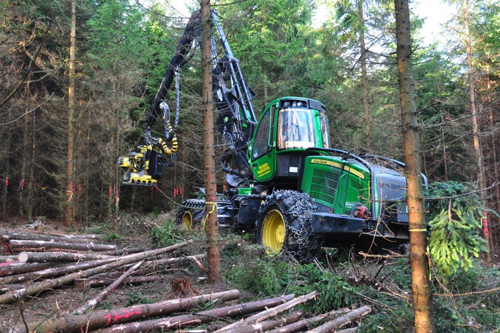
Fig. 4. Harvester John Deere 1170E with H414 harvester head-unit at the thinning operation on the skid trail with already processed logs along the skid trail and the stand to be thinned in front of the harvester.
| Table 3. Description of defined work phases with its starting and end point. | ||
| Working phase | Starting point | End |
| driving & catching | starts when the head is fully opened and the top is released | ends with the beginning of the next fell cut |
| felling, delimbing & bucking of logs | starts with the fell cut | ends with the opening of the felling head after processing is finished |
| other work | all activities which are not associated with a tree having a unique identification number | |
| delay | time not related to effective work (e.g., breaks, repairs, etc.) | |
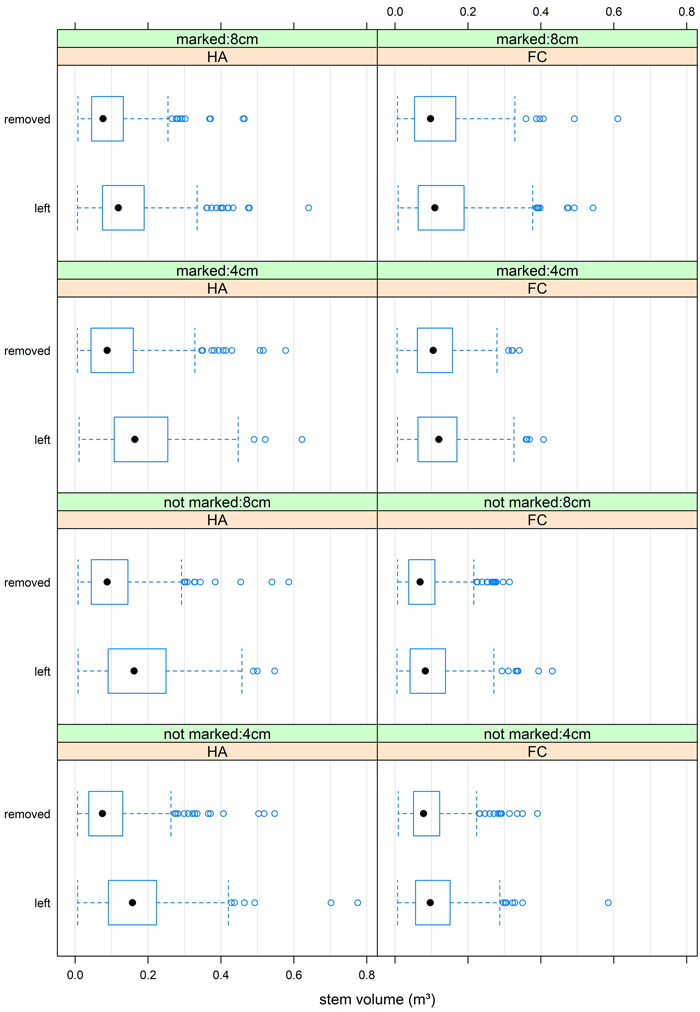
Fig. 5. Single stem volume for removed, as well as left trees, over all plots separated by marking, thinning methods and topping diameter – heavy thinning from above (HA) or final crop tree thinning with removal of the 1–2 strongest competitors (FC).
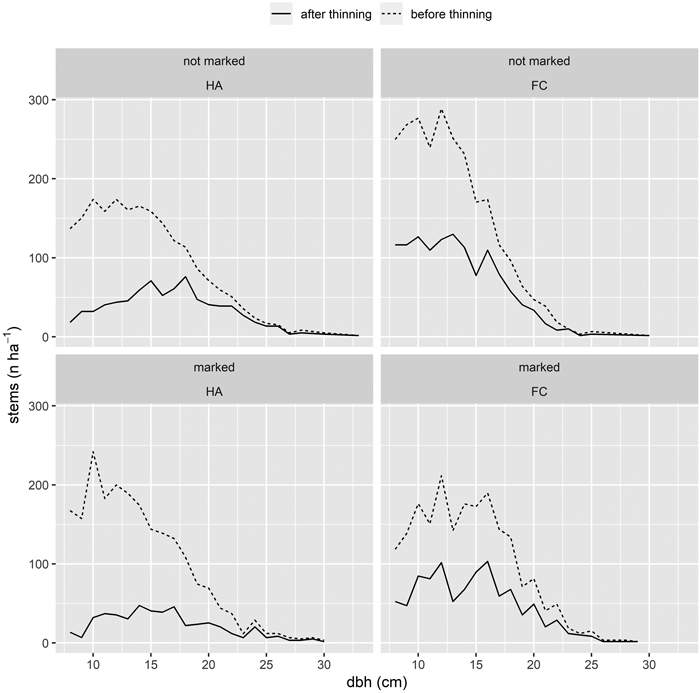
Fig. 6. Diameter at breast height (cm) distributions for marked and not marked and both thinning methods HA and FC before and after harvesting.
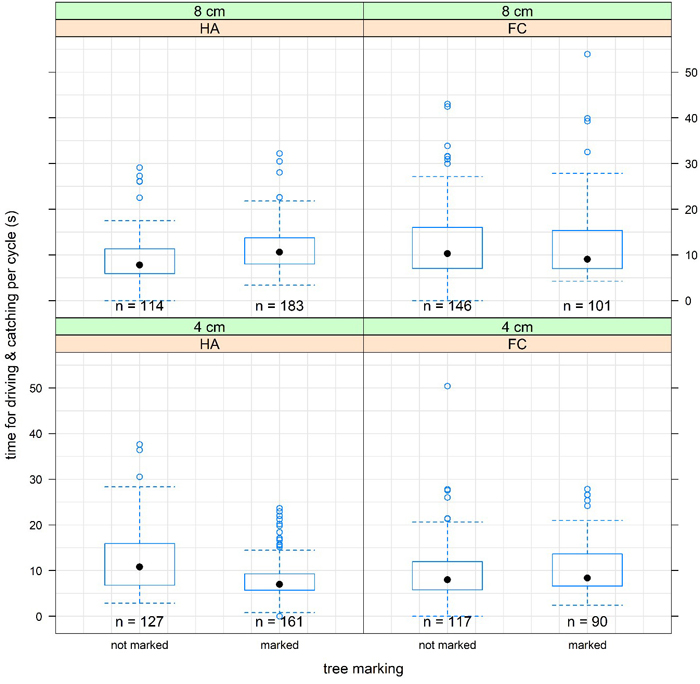
Fig. 7. Time consumption for driving and catching per cycle separated by the factors tree marking, thinning type and bucking instructions. Here, only cycles where numbered trees had been cut are shown.
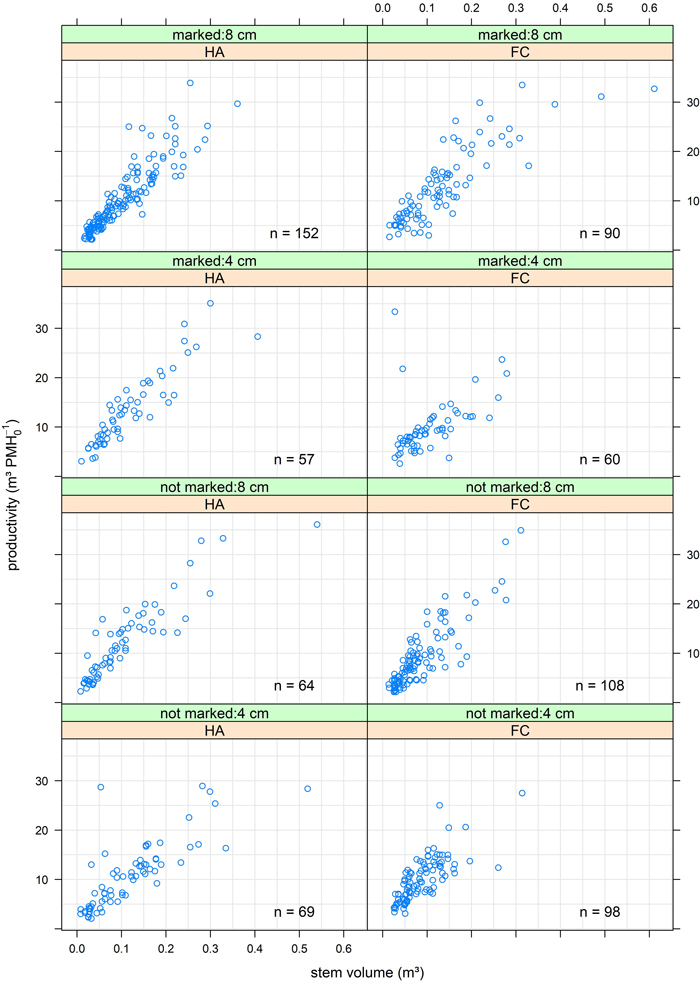
Fig. 8. Productivity as a function of stem volume and experiment option. FC = final crop tree thinning, HA = heavy thinning from above, tree marking “not marked” or “marked” and topping diameter “4 cm” or “8 cm”.
| Table 4. Analysis of variance of the fitted model (lm) for the listed independent variables and their effect on harvesting productivity (m3 PMH0–1). | ||||||
| Variable | DF | SS | Mean Sq | F-value | p-value | |
| stem volumee | 1 | 21130.0 | 21130.0 | 1757.9586 | <2.2e-16 | *** |
| marking | 1 | 10.1 | 10.1 | 0.8363 | 0.36077 | |
| topping | 1 | 9.2 | 9.2 | 0.7663 | 0.38168 | |
| thinning | 1 | 40.6 | 40.6 | 3.3779 | 0.06651 | . |
| stem volumee × marking | 1 | 25.5 | 25.5 | 2.1198 | 0.14586 | |
| stem volumee × topping | 1 | 237.1 | 237.1 | 19.7243 | 1.043e-05 | *** |
| stem volumee × thinning | 1 | 46.3 | 46.3 | 3.8549 | 0.05001 | . |
| marking × thinning | 1 | 1.6 | 1.6 | 0.1361 | 0.71232 | |
| marking × topping | 1 | 75.2 | 75.2 | 6.2539 | 0.01262 | * |
| topping × thinning | 1 | 5.7 | 5.7 | 0.4704 | 0.49302 | |
| marking × topping × thinning | 1 | 290.9 | 290.9 | 24.2018 | 1.087e-06 | *** |
| Residuals | 685 | 8233.5 | 12.0 | |||
| DF = Degrees of freedom, SS = Sums of squares Signif. codes: *** = 0, ** = 0.001, * = 0.01, . = 0.05 | ||||||
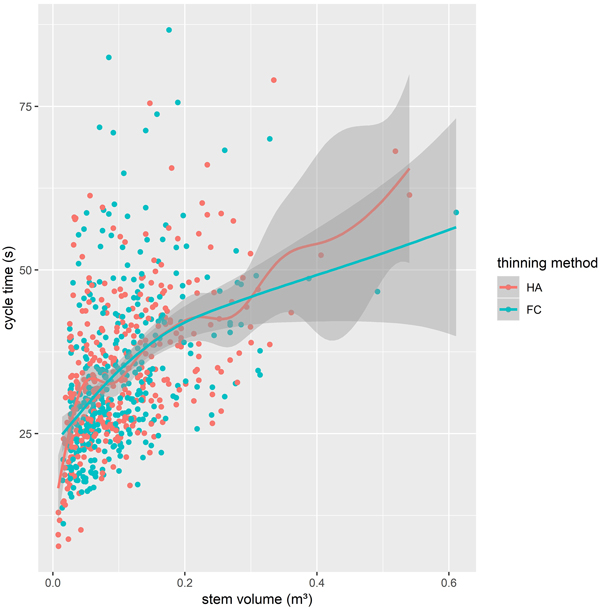
Fig. 9. Dependency of cycle time on the stem volume and thinning method with generalized additive model fitted lines and standard error of the fitted models.
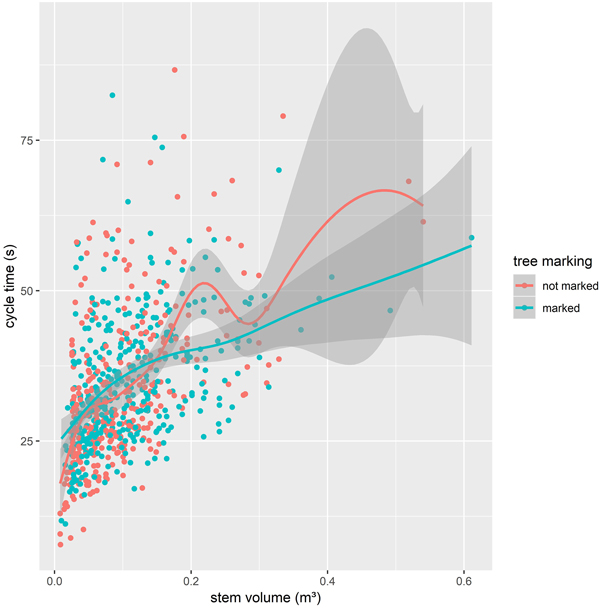
Fig. 10. Dependency of cycle time on the stem volume and marking with generalized additive model fitted lines and standard error of the fitted models.
| Table 5. Analysis of variance of the fitted generalized additive model (GAM) for harvesting productivity (m3 PMH0–1) as dependent variable showing the significance of the listed effects. | |||||
| Effects | edf | Ref. df | DF | F-value | p-value |
| marking | 2 | 905.211 | <2e-16 | ||
| topping | 1 | 1.773 | 0.1835 | ||
| thinning | 1 | 0.024 | 0.8768 | ||
| marking × thinning | 1 | 1.184 | 0.2769 | ||
| marking × topping | 1 | 3.220 | 0.0732 | ||
| Approximate significance of smooth terms | |||||
| S(stem volume) | 4.254 | 5.253 | 329.9 | <2e-16 | |
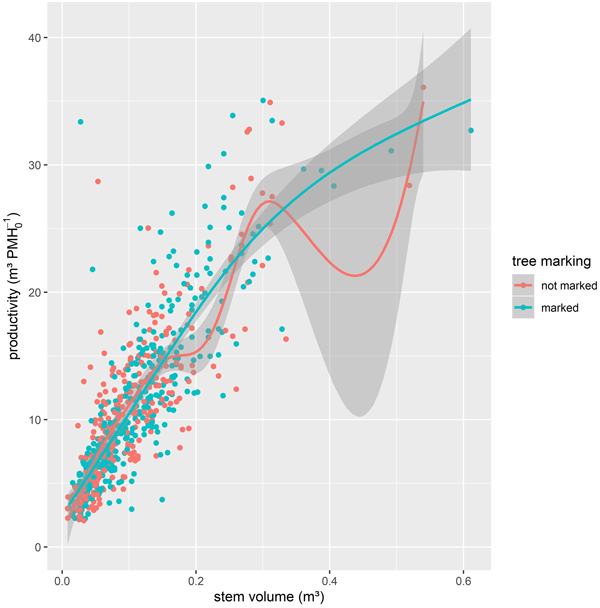
Fig. 11. Harvesting productivity depending on the stem volume and marking with generalized additive model smoothed lines and standard error of the fitted models.
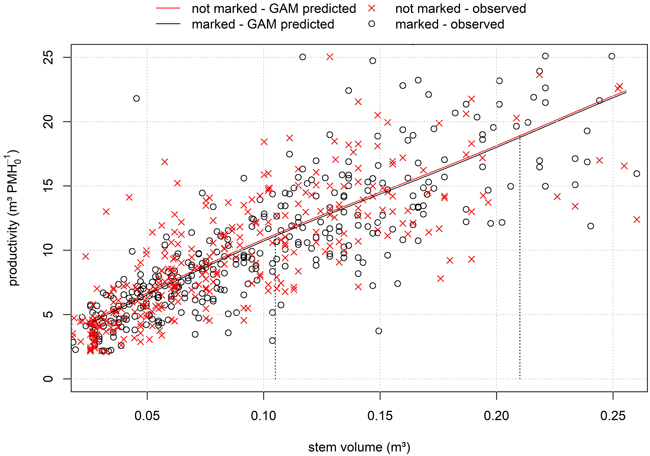
Fig. 12. Productivity depending on stem volume and tree marking using the GAM-model within the 5 and 95% quantiles of measured stem volume.
| Table 6. Modelled probability of a harvest damage to single residual trees (dependent variable) - analysis of coefficients for logit-model. | |||||
| Coefficients | Estimate | Std. error | z-value | Pr(>|z|) | |
| (Intercept) | –2.87919 | 0.40642 | –7.084 | 1.4e-12 | *** |
| marking | –0.78766 | 0.22322 | –3.529 | 0.000418 | *** |
| thinning | –0.20998 | 0.20826 | –1.008 | 0.313332 | |
| topping | 0.09812 | 0.04961 | 1.978 | 0.047930 | * |
| stem volume | –1.51966 | 1.13909 | –1.334 | 0.182172 | |
| Signif. codes: *** = 0, ** = 0.001, * = 0.01, .= 0.05 | |||||