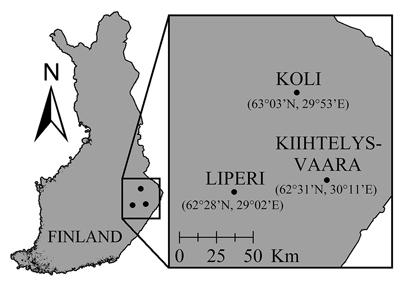
Fig. 1. Locations of the Liperi training site and the Kiihtelysvaara and Koli test sites. In Liperi, the field plots were located max. 20 km away from the presented point, whereas in Kiihtelysvaara and Koli sites, all plots were located <3 km away from the presented points.
| Table 1. Attributes of Scots pines used for training (Liperi site) and testing (Kiihtelysvaara and Koli sites) the mixed effect models. N = number, DBH = diameter at breast height, H = height, CBH = Crown base height. The range of values is given in parentheses. |
| Site | Coordinates | Nplot | Ntree | Mean DBH, cm | Mean H, m | Mean CBH, m |
| Liperi | 62°28´N, 29°02´E | 47 | 1051 | 24.8 (17.0–48.1) | 21.2 (12.4–35.6) | 13.3 (5.1–27.3) |
| Kiihtelysvaara | 62°31´N, 30°11´E | 66 | 414 | 23.1 (16.0–42.8) | 19.5 (12.3–34.3) | 11.0 (3.7–24.3) |
| Koli | 63°03´N, 29°53´E | 14 | 317 | 24.6 (16.1–44.4) | 19.9 (11.2–28.8) | 11.2 (2.8–21.8) |
| Table 2. Details of the laser scanning data obtained from the training (Liperi) and test (Kiihtelysvaara and Koli) sites. |
| Site | Liperi | Kiihtelysvaara | Koli |
| Scanning time (month/year) | 7/2016 | 6/2009 | 7/2005 |
| Sensor type | Optech Titan | Optech ALTM Gemini | Optech ALTM 3100 |
| Flying altitude (m) | 850 | 600 | 900 |
| Scanning angle (°) | 40 | 26 | 22 |
| Pulse frequency (kHz) | 250 | 100 | 100 |
| Overlap (%) | 55 | 55 | 35 |
| Strip width on ground (m) | 650 | 320 | 350 |
| Mean pulse density (m–2) | 13.2 | 14.7 | 5.2 |
| Echoes/crown (First) | 243 | 276 | 147 |
| Echoes/crown (Last) | 74 | 90 | 75 |
| Table 3. A list of the predictor variables extracted from airborne laser scanning data. In the height percentiles, i = 5, 10, 15…80, 90, 95 and 99. |
| ALS metric | Definition | Computed for |
| TotalReturns | Total number of returns | Trees |
| TotalFirst | Total number of first returns | Plots |
| EWIDTH/NWIDTH | Tree crown width and depth | Trees |
| HMAX | Maximum height | Trees & plots |
| HMIN | Minimum height | Plots |
| HMEDIAN | Median height | Trees & plots |
| HMEAN | Mean height | Trees & plots |
| HSD | Standard deviation of heights | Trees & plots |
| HCV | Coefficient of variation of heights | Trees & plots |
| ICV | Coefficient of variation of intensities | Trees & plots |
| HMOD | Mode of heights | Trees & plots |
| H01TH | 1st percentile of heights | Plots |
| HiTH | ith percentile of heights | Trees & plots |
| HVAR | Variance of heights | Trees & plots |
| HKUR | Kurtosis of heights | Trees & plots |
| IKUR | Kurtosis of intensities | Trees & plots |
| HSKE | Skewness of heights | Trees & plots |
| ISKE | Skewness of intensities | Trees & plots |
| CRR | Canopy relief ratio | Plots |
| Table 4. Parameter estimates of the mixed effects models for diameter at breast height (DBH), height (H), and crown base height (CBH). For the fixed parameters, the standard error is given in parentheses. Subscripts t and p denote tree and plot level metrics, respectively. Variances and covariances of random parameters (unk) and residual errors (enki) are given (correlation shown in parenthesis). The abbreviations of the predictors are explained in Table 3. |
| Predictor | DBH, cm | H, m | CBH, m |
| Intercept | 28.284 (10.071) | 1.756 (0.178) | –0.466 (0.593) |
| H50t | | | 0.660 (0.032) |
| H90t | | 0.523 (0.041) | |
| H95t | 2.154 (0.265) | | |
| ln(H95t) | –18.664 (5.057) | | |
| HMAXt | | 0.460 (0.039) | |
| HMEANp | | | 0.237 (0.062) |
| ln(NWIDTH) | 2.313 (0.330) | | |
| EWIDTH | 2.121 (0.378) | | |
| EWIDTH2 | –0.128 (0.035) | | |
| H70p | –0.009 (0.002) | | |
| ISKEt | –4.425 (0.420) | | 1.309 (0.207) |
| IKURt | 1.113 (0.206) | | –0.367 (0.101) |
| HMEANt/EWIDTH | | | 0.151 (0.047) |
| Random effects | | | |
| var(unk) | 0.818 | 0.071 | 0.976 |
| cov(unk,un+1k) | u1k | u2k | u3k |
| u2k | 0.066 (0.273) | | |
| u3k | –0.159 (–0.178) | 0.083 (0.315) | |
| var(enki) | 6.644 | 0.310 | 1.556 |
| cov(enki,en+1ki) | e1ki | e2ki | e3ki |
| e2ki | 0.069 (0.048) | | |
| e3ki | –0.809 (–0.252) | 0.048 (0.069) | |
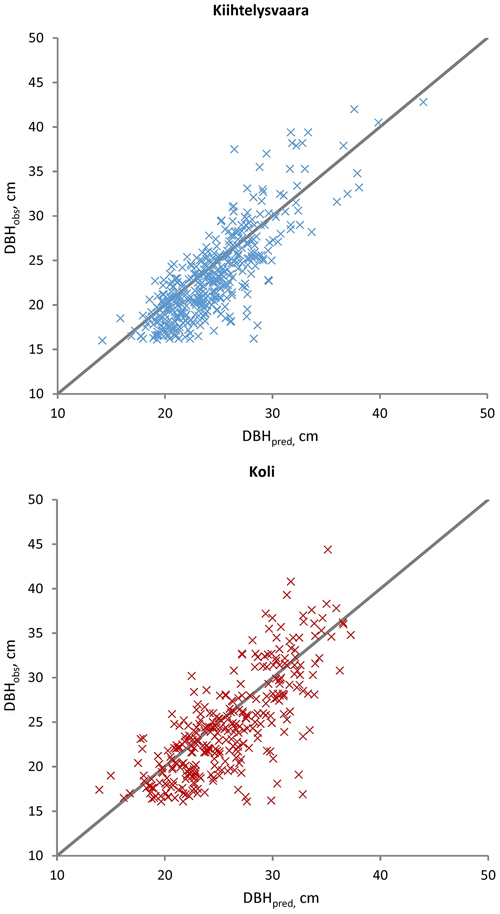
Fig. 2. Observed (DBHobs) versus predicted (DBHpred) Scots pine diameters in the Kiihtelysvaara and Koli test sites. The predicted values were obtained with the fixed part of the mixed model trained at the Liperi site.
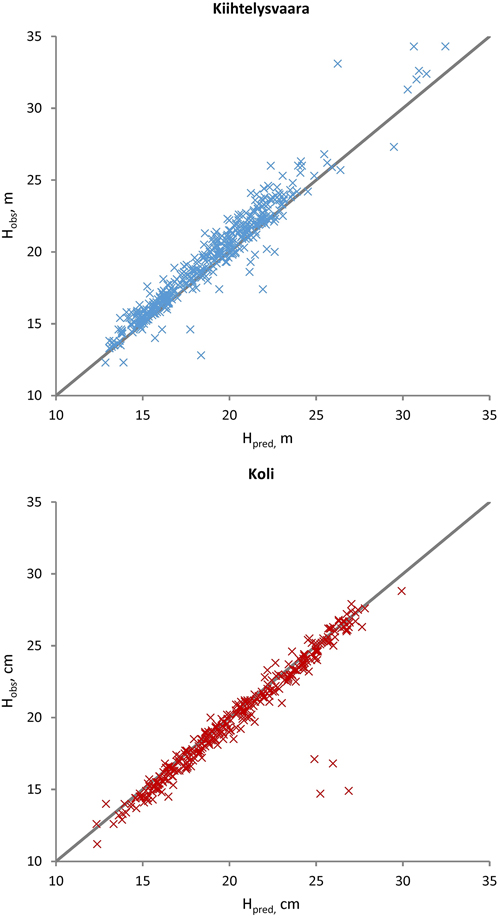
Fig. 3. Observed (Hobs) versus predicted (Hpred) Scots pine heights at the Kiihtelysvaara and Koli test sites. The predicted values were obtained with the fixed part of the mixed model trained at the Liperi site.
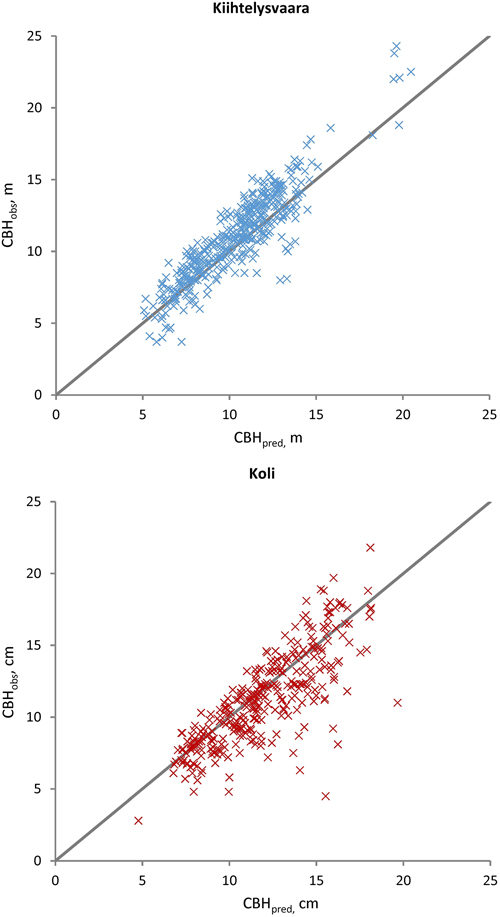
Fig. 4. Observed (CBHobs) versus predicted (CBHpred) Scots pine crown base heights at the Kiihtelysvaara and Koli test sites. The predicted values were obtained with the fixed part of the mixed model trained at the Liperi site.
| Table 5. Root mean square errors (RMSE) and mean differences (MD) between the observed diameter at breast height (DBH), height (H), and crown base height (CBH) and the estimates obtained from the mixed effects models. The results are shown for the training site (Liperi) and for the two test sites (Kiihtelysvaara and Koli). Calibrations were made at the test sites using the pines with minimum and median diameters. |
| | | Liperi | Kiihtelysvaara | Koli |
| DBH | RMSE, cm | 2.7 | 3.1 | 3.91 |
| RMSE% | 10.9 | 13.4 | 15.9 |
| RMSE calibrated, cm | | 2.87 | 3.58 |
| RMSE% calibrated | | 12.4 | 14.6 |
| MD, cm | 0 | –1.3 | –1.3 |
| MD% | 0 | –5.7 | –5.4 |
| MD calibrated, cm | | –0.77 | –0.7 |
| MD% calibrated | | –3.3 | –2.8 |
| H | RMSE, m | 0.6 | 1.09 | 1.28 |
| RMSE%, m | 2.8 | 5.6 | 6.4 |
| RMSE calibrated, m | | 0.99 | 1.16 |
| RMSE% calibrated | | 5.1 | 5.8 |
| MD, m | 0 | 0.61 | –0.48 |
| MD% | 0 | 3.1 | –2.4 |
| MD calibrated, m | | 0.51 | –0.22 |
| MD% calibrated | | 2.6 | –1.1 |
| CBH | RMSE, m | 1.6 | 1.46 | 2.07 |
| RMSE% | 12.0 | 13.3 | 18.5 |
| RMSE calibrated, m | | 1.26 | 1.9 |
| RMSE% calibrated | | 11.5 | 17.0 |
| MD fixed, m | 0 | 0.68 | –0.65 |
| MD% fixed | 0 | 6.2 | –5.8 |
| MD calibrated, m | | 0.24 | –0.33 |
| MD% calibrated | | 2.2 | –2.9 |