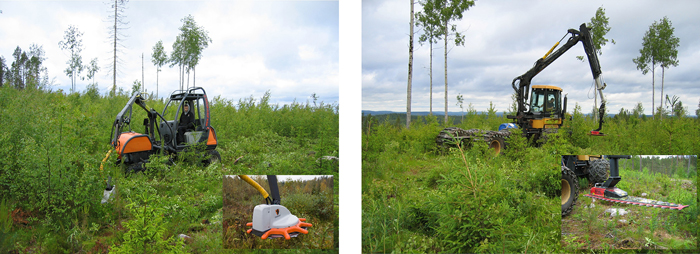
Fig. 1. Machines used in the study: Usewood Tehojätkä small-scale forest machine equipped with UW40-cleaning head (left) and Mense RP6L equipped on the boom of the harvester (right) Photos: Veli-Matti Saarinen and UW40-cleaning head: www.usewood.fi.
| Table 1. Number of stumps, their diameter and height, and stand density before and after the early pre-commercial thinning. | ||||
| Mense | Tehojätkä* | Control | Pooled* | |
| Number of stumps | 111 | 150 (38) | 100 | 361 (249) |
| Birch | 38 | 63 (11) | 22 | 123 (71) |
| Aspen | 21 | 24 (3) | 50 | 95 (74) |
| Rowan | 22 | 42 (15) | 13 | 77 (50) |
| Willow | 30 | 21 (9) | 15 | 66 (54) |
| Stump diameter (mm) | 13.3 ± 4.7 | 11.4 ± 4.5 | 13.7 ± 6.9 | 12.6 ± 5.4 |
| Birch | 13.2 ± 5.3 | 11.4 ± 5.1 | 13.7 ± 9.5 | 12.4 ± 6.2 |
| Aspen | 15.9 ± 5.7 | 12.8 ± 4.5 | 14.5 ± 6.1 | 14.4 ± 5.7 |
| Rowan | 12.6 ± 3.6 | 11.6 ± 4.0 | 12.6 ± 4.5 | 12 0 ± 3.9 |
| Willow | 12.3 ± 3.2 | 9.7 ± 3.2 | 12.1 ± 6.7 | 11.3 ± 4.3 |
| Stump height (cm) | 34.9 ± 15.4 | 28.7 ± 10.7 | 32.2 ± 11.7 | 31.6 ± 12.8 |
| Birch | 34.8 ± 14.5 | 29.8 ± 9.8 | 33.2 ± 14.5 | 32.0 ± 12.4 |
| Aspen | 32.6 ± 12.8 | 28.7 ± 12.8 | 33.8 ± 10.7 | 32.3 ± 11.8 |
| Rowan | 32.9 ± 19.9 | 28.8 ± 11.4 | 29.8 ± 9.4 | 30.0 ± 14.1 |
| Willow | 37.9 ± 14.8 | 25.4 ± 8.8 | 27.8 ± 11.8 | 31.7 ± 12.8 |
| Density (ha–1) | ||||
| Saplings (before) | 12 591 ± 6543 | 15 420 ± 10 729 | 16 824 ± 7251 | 13 896 ± 8403 |
| Stumps | 7851 ± 6635 | 10 610 ± 9693 | 7234 ± 4089 | 8575 ± 7641 |
| Saplings (after) | 4739 ± 3693 | 4810 ± 3755 | 6438 ± 5717 | 5321 ± 3899 |
| * Year 2018 value in parentheses (2/3 of blocks were destroyed due to land use changes in the area). | ||||
| Table 2. The effects of (1) the treatment (the control vs. the fungal treatments done by Tehojätkä or Mense), (2) tree species (birch vs. aspen, rowan or willow), (3) the number of saplings and stumps on a plot, and (4) the diameter of an investigated stump (mm) on the mortality of stumps (0 = alive, 1 = dead) one (2016, n = 361), two (2017, n = 361), and three years (2018, n = 249) after the early pre-commercial thinning, as well as on the number of sprouts in a stump one (2016, n = 282), two (2017, n = 282), and three years (2018, n = 194) after the early pre-commercial thinning (generalized linear mixed models). Statistically significant p-values (p < 0.05) are in bold and indicative results have been underlined (0.05 ≤ p ≤ 0.10). See also Fig. 2. | ||||||
| Explanatory variables | Year 2016 | Year 2017 | Year 2018 | |||
| Coeff. ± SE | p | Coeff. ± SE | p | Coeff. ± SE | p | |
| Mortality | ||||||
| Intercept | –3.469 ± 0.765 | <0.001 | –3.628 ± 0.833 | <0.001 | –3.112 ± 0.985 | 0.002 |
| Treatment (compared to the control) | ||||||
| Tehojätkä | 1.298 ± 0.446 | 0.004 | 1.551 ± 0.472 | 0.001 | 1.200 ± 0.646 | 0.006 |
| Mense | 1.455 ± 0.445 | 0.001 | 1.601 ± 0.462 | <0.001 | 1.521 ± 0.469 | 0.001 |
| Tree species (compared to birch) | ||||||
| Aspen | 0.047 ± 0.356 | 0.894 | –0.216 ± 0.362 | 0.550 | 0.206 ± 0.450 | 0.647 |
| Rowan | –1.954 ± 0.574 | <0.001 | –2.504 ± 0.654 | <0.001 | –3.153 ± 1.08 | 0.003 |
| Willow | –0.585 ± 0.407 | 0.150 | –0.806 ± 0.412 | 0.050 | –0.895 ± 0.492 | 0.069 |
| Density (saplings per plot) | 0.139 ± 0.056 | 0.013 | 0.068 ± 0.057 | 0.233 | 0.123 ± 0.102 | 0.226 |
| Stump diameter (mm) | 0.040 ± 0.028 | 0.146 | 0.087 ± 0.030 | 0.003 | 0.036 ± 0.032 | 0.252 |
| Number of stump sprouts | ||||||
| Intercept | 0.783 ± 0.199 | <0.001 | 0.797 ± 0.182 | <0.001 | 0.703 ± 0.230 | 0.002 |
| Treatment (compared to the control) | ||||||
| Tehojätkä | –0.107 ± 0.132 | 0.416 | –0.071 ± 0.106 | 0.500 | 0.046 ± 0.153 | 0.763 |
| Mense | 0.107 ± 0.131 | 0.416 | 0.138 ± 0.104 | 0.185 | 0.126 ± 0.109 | 0.249 |
| Tree species (compared to birch) | ||||||
| Aspen | –0.189 ± 0.114 | 0.097 | –0.088 ± 0.110 | 0.425 | 0.084 ± 0.141 | 0.552 |
| Rowan | 0.887 ± 0.100 | <0.001 | 0.795 ± 0.100 | <0.001 | 0.871 ± 0.131 | <0.001 |
| Willow | 0.434 ± 0.101 | <0.001 | 0.434 ± 0.103 | <0.001 | 0.418 ± 0.133 | 0.002 |
| Density (saplings per plot) | –0.031 ± 0.019 | 0.103 | –0.037 ± 0.017 | 0.028 | –0.051 ± 0.025 | 0.041 |
| Stump diameter (mm) | 0.038 ± 0.007 | <0.001 | 0.034 ± 0.007 | <0.001 | 0.026 ± 0.008 | 0.001 |
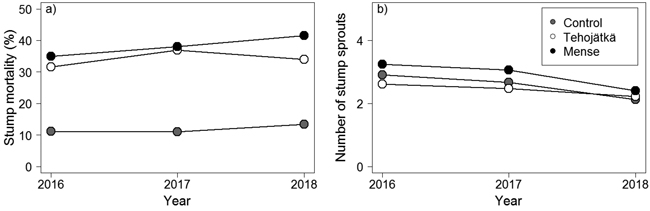
Fig. 2. The effects of the control (cutting only) and the fungal treatments done by Tehojätkä and Mense on a) the mortality of birch stumps (%), and b) the number of stump sprouts per stump one, two and three years after the early pre-commercial thinning. Figures have been drawn based on the predicted values of the generalized linear mixed models for birch, see Table 2.