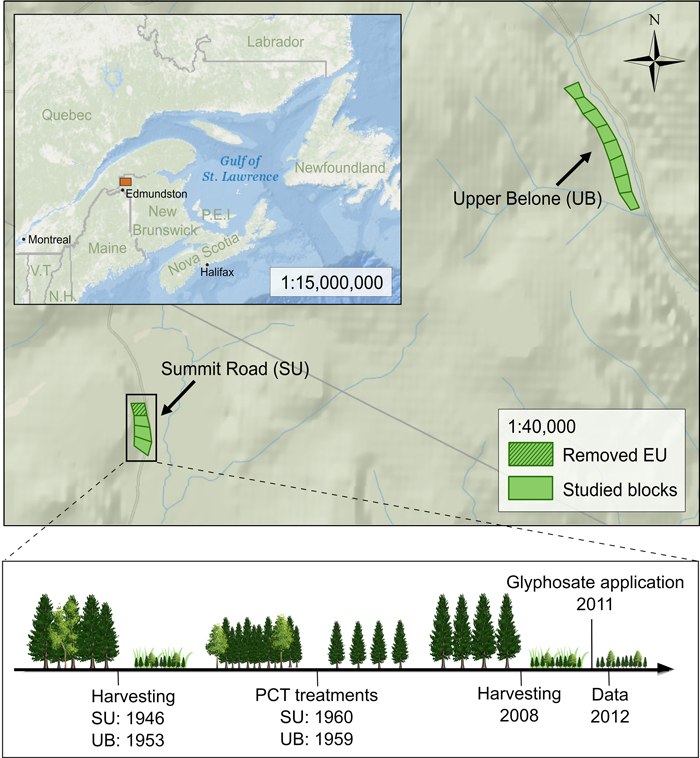
Fig. 1. Replicate blocks and sequence of treatments of the Green River precommercial thinning study within balsam fir stands in northwestern New Brunswick (Canada). The studied blocks contained four experimental units (EU; 1–2 ha) that were treated with silviculture scenarios including one of three increasing precommercial thinning (PCT) intensity (1.2 m nominal spacing, 1.8 m nominal spacing, 2.4 m nominal spacing) or an unthinned control. The timeline provides the date for the silvicultural treatments applied. Aerial glyphosate application was of 1.62 kg ha–1 of active ingredient. Two blocks are side-by-side at UB. Note that the 1.8 m nominal spacing treatment at SU (hatched EU in the figure) was excluded from the analyses due to major blowdown from the adjacent stand, hence resulting in an incomplete randomized block design. The chronosequence was designed using resources from Freepik.com.
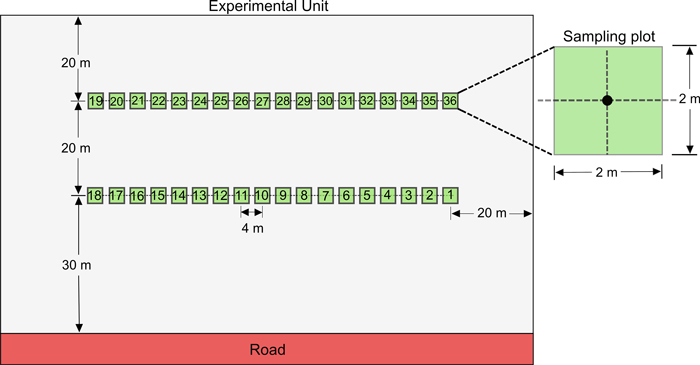
Fig. 2. Schematic representation of one of the 11 experimental units (EU) established within the three blocks. We established a total of 36 sampling plots within each EU. Sampling plot centers were spaced 4 m apart along two parallel 68-m long transects located 20 m apart. The minimal distances were 30 m and 20 m from main roads and EU limits, respectively.
| Table 1. ANOVA summary for conifer seedling characteristics, competition and debris, stem density and stocking in next rotation balsam fir stands as influenced by different intensities of precommercial thinning in previous stands. | |||
| Variable | F value | p-value | |
| Conifer seedling characteristics | Stem height (cm) ** | 1.182 | 0.405 |
| Stem basal diameter (mm) ** | 3.301 | 0.116 | |
| Crown area (cm2) ** | 0.962 | 0.479 | |
| Competition and debris | Slash cover (%) * | 2.490 | 0.175 |
| Large woody debris cover (%) * | 1.770 | 0.269 | |
| Total debris cover (%) * | 2.033 | 0.228 | |
| Competing vegetation cover (%) * | 0.387 | 0.768 | |
| Stem density | Balsam fir density (stems/ha) ** | 1.285 | 0.375 |
| Spruce density (stems/ha) ** | 0.089 | 0.963 | |
| Conifer density (stems/ha) ** | 1.188 | 0.403 | |
| Other species density (stems/ha) ** | 0.517 | 0.689 | |
| Stocking | Conifer stocking (%) * | 5.969 | 0.042 |
| Other species stocking (%) * | 0.401 | 0.759 | |
| For all analyses, degrees of freedom were 3 and 5 at numerator and denominator, respectively. We performed analyses on transformed data: * inverse sine transformation; ** square root transformation. We used p = 0.05 as a threshold for significance. | |||
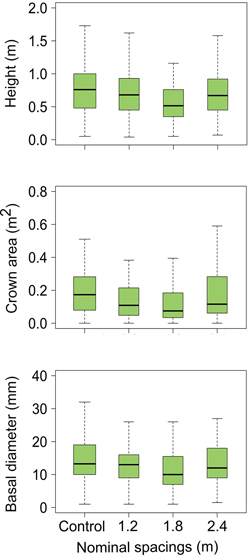
Fig. 3. Estimated values (lower hinge = within 1.5 times interquartile range below first quartile, lower end of box = first quartile, middle of box = median, upper end of box = third quartile, upper hinge = within 1.5 times interquartile range above third quartile) for conifer seedling characteristics in next rotation balsam fir stands as influenced by different intensities of precommercial thinning in previous stands.
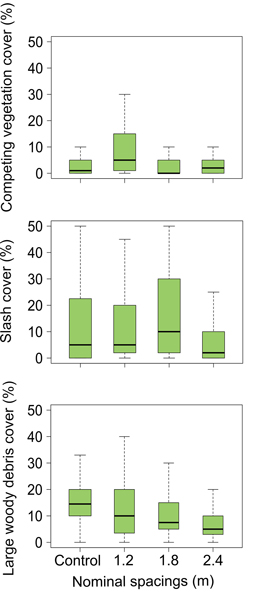
Fig. 4. Estimated values (lower hinge = within 1.5 times interquartile range below first quartile, lower end of box = first quartile, middle of box = median, upper end of box = third quartile, upper hinge = within 1.5 times interquartile range above third quartile) for competition and debris in next rotation balsam fir stands as influenced by different intensities of precommercial thinning in previous stands. Large woody debris include stumps and debris > 5 cm in diameter. Slash include piles made of several stems of woody debris.
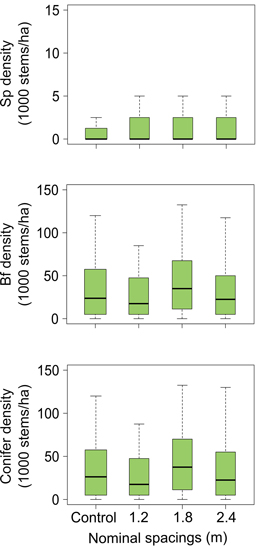
Fig. 5. Estimated values (lower hinge = within 1.5 times interquartile range below first quartile, lower end of box = first quartile, middle of box = median, upper end of box = third quartile, upper hinge = within 1.5 times interquartile range above third quartile) for stem density in next rotation balsam fir stands as influenced by different intensities of precommercial thinning in previous stands. Note the differences in y-axes range. Sp = spruce; Bf = balsam fir.
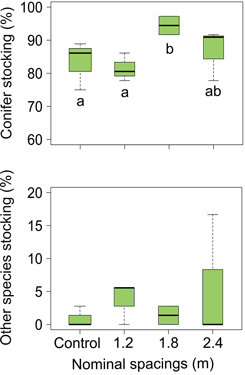
Fig. 6. Estimated values (lower hinge = within 1.5 times interquartile range below first quartile, lower end of box = first quartile, middle of box = median, upper end of box = third quartile, upper hinge = within 1.5 times interquartile range above third quartile) for stocking in next rotation balsam fir stands as influenced by different intensities of precommercial thinning in previous stands. Conifer stocking boxplot shows result of multiple comparison for significance. Note the differences in y-axes range.