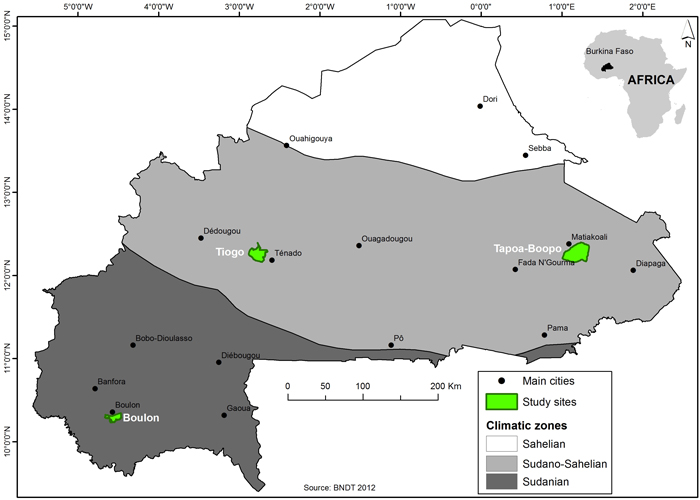
Fig. 1. Location of the study area (Bolon, Tapoa-Boopo and Tiogo forests) in Burkina Faso. View larger in new window/tab.
| Table 1. Biophysical characteristics of Bolon, Tapoa-Boopo and Tiogo forests (Guinko 1984). | |||
| Protected areas | Boulon | Tapoa-Boopo | Tiogo |
| Region | Cascades | Eastern | Central-West |
| Location | 10°15´–10°22´N; 4°20´–4°38´W | 12°10´–12°23´N; 0°58´–1°13´W | 12°10´–12°25´N; 2°39´–2°54´W |
| Area (ha) | 13 521.70 | 36 202.30 | 30 339 |
| Climate | Sudanian | Sudano-Sahelian | Sudano-Sahelian |
| Annual rainfall (mm) | 900–1100 | 600–900 | 600–900 |
| Rainfall regime | Unimodal | Unimodal | Unimodal |
| Temperature range (°C) | 17–36 | 25–33 | 25–35 |
| Main vegetation | Dense dry forest, savannas | Tree and shrub savannas | Tree and shrub savannas |
| Table 2. Summary statistics of sample tree characteristics and biomass data. | |||||||||||||
| Site | Sample trees | DBH (cm) | Height (m) | D20 (cm) | CD (m) | Aboveground tree biomass (kg) | |||||||
| Mean | Range | Mean | Range | Mean | Range | Mean | Range | Stem | Branch | Leaves | Aboveground | ||
| Boulon | 13 | 29.6±4.6 | 14.6–73.5 | 8.5±0.7 | 6.0–14.9 | 35.8±6.3 | 18.1–98.5 | 6.8±0.8 | 3.7–13.6 | 119.7±55.4 | 224.1±97.7 | 12.7±3.7 | 356.6±153.1 |
| Tapoa | 13 | 26.1±4.4 | 11.5–61.5 | 6.6±0.5 | 3.5–9.2 | 31.9±5.6 | 14.5–76.1 | 5.7±0.8 | 2.9–11.9 | 78.2±24.6 | 157.9±73.9 | 18.2±7.1 | 254.3±102.0 |
| Tiogo | 13 | 27.58±4.5 | 9.4–59.5 | 7.1±0.8 | 1.7–12.0 | 33.2±5.4 | 13.5–75.5 | 5.9±1.1 | 1.9–16.1 | 94.4±34.2 | 213.8±87.5 | 36.2±11.6 | 344.4±129.1 |
| DBH: Diameter at breast height; D20: basal diameter; CD: height and crown diameter. | |||||||||||||
| Table 3. Allometric models developed for estimation of biomass of stem, branches and leaves of Diospyros mespiliformis in Burkina Faso. ln(β0), β1 and γ represent the intercept and regression coefficients of the models, and their respective standard errors. The indicators of performance for the models include the adjusted coefficient of determination (Adj.R2), residual standard error (RSE), root mean squared error (RMSE), Akaike information criterion (AIC) and correction factor (CF). | |||||||||
| Regression coefficients | Performance criteria | ||||||||
| Equation | Predictors | ln(β0) | β1 | γ | Adj.R2 | RSE | RMSE | AIC | CF |
| Boulon (Sudanian zone) | |||||||||
| Stem biomass | |||||||||
| Eq(5) | DBH | –3.25***±0.48 | 2.22***±0.15 | 94.70 | 0.327 | 0.300 | 11.62 | 1.055 | |
| D20 | –4.27***±0.48 | 2.39***±0.14 | 96.02 | 0.283 | 0.260 | 07.89 | 1.041 | ||
| CD | 0.29ns ±0.53 | 2.14***±0.31 | 79.85 | 0.637 | 0.586 | 28.98 | 1.225 | ||
| Eq(6) | DBH2×H | –3.08**±0.84 | 0.84***±0.10 | 84.83 | 0.552 | 0.508 | 25.28 | 1.165 | |
| DBH2×CD | –2.22***±0.49 | 0.76***±0.06 | 92.76 | 0.382 | 0.351 | 15.68 | 1.076 | ||
| D202×H | –3.68**±0.96 | 0.87***±0.11 | 83.61 | 0.574 | 0.528 | 26.29 | 1.179 | ||
| D202×CD | –2.85***±0.51 | 0.79***±0.06 | 93.59 | 0.359 | 0.330 | 14.09 | 1.067 | ||
| Eq(7) | DBH2×H; CD | –2.11ns ±1.14 | 0.56*±0.24 | 0.78ns ±0.65 | 85.48 | 0.540 | 0.474 | 25.48 | 1.157 |
| D202×H; CD | –2.37ns ±1.28 | 0.54ns ±0.24 | 0.90ns ±0.62 | 85.17 | 0.546 | 0.479 | 25.75 | 1.161 | |
| Branch biomass | |||||||||
| Eq(5) | DBH | –4.47***±0.64 | 2.73***±0.20 | 93.93 | 0.591 | 0.395 | 18.77 | 1.097 | |
| D20 | –5.58***±0.81 | 2.89***±0.24 | 92.37 | 0.482 | 0.444 | 21.76 | 1.123 | ||
| CD | –0.32ns±0.50 | 2.76***±0.29 | 87.91 | 0.607 | 0.558 | 27.73 | 1.202 | ||
| Eq(6) | DBH2×H | –4.62***±0.72 | 1.07***±0.09 | 92.49 | 0.478 | 0.440 | 21.55 | 1.121 | |
| DBH2×CD | –3.32***±0.50 | 0.94***±0.06 | 95.03 | 0.389 | 0.358 | 16.18 | 1.079 | ||
| D202×H | –5.32***±0.95 | 1.10***±0.11 | 89.42 | 0.568 | 0.522 | 26.00 | 1.175 | ||
| D202×CD | –4.02***±0.60 | 0.98***±0.07 | 94.06 | 0.425 | 0.391 | 18.49 | 1.095 | ||
| Eq(7) | DBH2×H; CD | –3.30**±0.87 | 0.69**±0.19 | 1.08ns ±0.49 | 94.41 | 0.413 | 0.362 | 18.46 | 1.089 |
| D202×H; CD | –3.36*±1.08 | 0.62*±0.21 | 1.34*±0.52 | 93.00 | 0.462 | 0.405 | 21.39 | 1.112 | |
| Leaf biomass | |||||||||
| Eq(5) | DBH | –3.71***±0.58 | 2.09***±0.18 | 91.65 | 0.390 | 0.359 | 16.26 | 1.079 | |
| D20 | –4.58***±0.70 | 2.22***±0.21 | 90.48 | 0.417 | 0.383 | 17.97 | 1.091 | ||
| CD | –0.53ns ±0.43 | 2.10***±0.25 | 84.94 | 0.524 | 0.482 | 23.92 | 1.147 | ||
| Eq(6) | DBH2×H | –3.85***±0.62 | 0.82***±0.07 | 90.76 | 0.411 | 0.378 | 17.57 | 1.088 | |
| DBH2×CD | –2.82***±0.48 | 0.72***±0.06 | 92.44 | 0.371 | 0.342 | 14.97 | 1.071 | ||
| D202×H | –4.39***±0.78 | 0.85***±0.09 | 88.05 | 0.467 | 0.429 | 20.92 | 1.115 | ||
| D202×CD | –3.37***±0.55 | 0.75***±0.06 | 91.73 | 0.389 | 0.357 | 16.14 | 1.078 | ||
| Eq(7) | DBH2×H; CD | –2.95**±0.81 | 0.56**±0.17 | 0.74ns ±0.46 | 91.93 | 0.384 | 0.336 | 16.58 | 1.076 |
| D202×H; CD | –3.03*±0.97 | 0.51*±0.19 | 0.93ns ±0.47 | 90.60 | 0.414 | 0.363 | 18.56 | 1.090 | |
| Tapoa-Boopo (Sahelo-Sudanian zone) | |||||||||
| Stem biomass | |||||||||
| Eq(5) | DBH | –3.89 ***±0.63 | 2.39***±0.20 | 92.19 | 0.401 | 0.369 | 16.96 | 1.084 | |
| D20 | –4.37***±0.71 | 2.40***±0.21 | 91.43 | 0.420 | 0.386 | 18.17 | 1.092 | ||
| CD | –0.97ns ±0.64 | 2.77***±0.38 | 81.58 | 0.616 | 0.567 | 28.12 | 1.209 | ||
| Eq(6) | DBH2×H | –4.50***±0.51 | 0.99***±0.06 | 95.43 | 0.307 | 0.282 | 09.99 | 1.048 | |
| DBH2×CD | –3.15***±0.61 | 0.85***±0.08 | 91.07 | 0.429 | 0.394 | 18.69 | 1.096 | ||
| D202×H | –4.89***±0.59 | 0.99***±0.07 | 94.64 | 0.332 | 0.305 | 12.06 | 1.057 | ||
| D202×CD | –3.48***±0.67 | 0.85***±0.08 | 90.33 | 0.446 | 0.410 | 19.73 | 1.104 | ||
| Eq(7) | DBH2×H; CD | –4.66***±0.74 | 1.05***±0.19 | –0.17ns ±0.57 | 95.02 | 0.320 | 0.281 | 11.88 | 1.053 |
| D202×H; CD | –5.06**±0.89 | 1.05**±0.21 | –0.16ns ±0.63 | 94.15 | 0.347 | 0.304 | 13.97 | 1.062 | |
| Branch biomass | |||||||||
| Eq(5) | DBH | –4.99***±0.49 | 2.83***±0.16 | 96.39 | 0.316 | 0.291 | 10.78 | 1.051 | |
| D20 | –5.56***±0.58 | 2.84***±0.17 | 95.65 | 0.347 | 0.319 | 13.21 | 1.062 | ||
| CD | –1.68*±0.54 | 3.36***±0.32 | 90.15 | 0.522 | 0.480 | 23.83 | 1.146 | ||
| Eq(6) | DBH2×H | –5.46***±0.69 | 1.15***±0.08 | 93.97 | 0.408 | 0.376 | 17.44 | 1.087 | |
| DBH2×CD | –4.17***±0.43 | 1.02***±0.05 | 96.70 | 0.302 | 0.278 | 09.62 | 1.047 | ||
| D202×H | –5.90***±0.76 | 1.15***±0.09 | 93.20 | 0.434 | 0.399 | 19.00 | 1.099 | ||
| D202×CD | –4.56***±0.50 | 1.02***±0.06 | 95.96 | 0.334 | 0.307 | 12.23 | 1.057 | ||
| Eq(7) | DBH2×H; CD | –4.34***±0.85 | 0.76***±0.22 | 1.23ns ±0.65 | 95.12 | 0.367 | 0.322 | 15.45 | 1.069 |
| D202×H; CD | –4.53**±1.02 | 0.73*±0.24 | 1.31ns ±0.71 | 94.41 | 0.393 | 0.345 | 17.22 | 1.080 | |
| Leaf biomass | |||||||||
| Eq(5) | DBH | –4.64***±0.65 | 2.17***±0.21 | 90.17 | 0.412 | 0.379 | 17.65 | 1.088 | |
| D20 | –5.09***±0.70 | 2.18***±0.21 | 89.93 | 0.417 | 0.383 | 17.95 | 1.091 | ||
| CD | –2.19*±0.47 | 2.62***±0.28 | 88.10 | 0.453 | 0.417 | 20.12 | 1.108 | ||
| Eq(6) | DBH2×H | –5.02***±0.74 | 0.88***±0.109 | 88.63 | 0.443 | 0.407 | 19.53 | 1.103 | |
| DBH2×CD | –4.04***±0.55 | 0.78***±0.07 | 91.60 | 0.381 | 0.350 | 15.59 | 1.075 | ||
| D202×H | –5.38***±0.79 | 0.88***±0.09 | 88.29 | 0.449 | 0.413 | 19.92 | 1.106 | ||
| D202×CD | –4.36***±0.58 | 0.78***±0.07 | 91.24 | 0.389 | 0.357 | 16.14 | 1.078 | ||
| Eq(7) | DBH2×H; CD | –3.85**±0.93 | 0.47ns ±0.24 | 1.30ns ±0.71 | 90.62 | 0.402 | 0.353 | 17.79 | 1.084 |
| D202×H; CD | –3.99**±1.06 | 0.46ns ±0.25 | 1.33ns ±0.74 | 90.25 | 0.410 | 0.359 | 18.29 | 1.088 | |
| D202×H; CD | –3.82***±0.52 | 0.84***±0.12 | 0.76ns ±0.36 | 97.09 | 0.201 | 0.176 | –0.285 | 1.020 | |
| Tiogo (Sahelo-Sudanian zone) | |||||||||
| Stem biomass | |||||||||
| Eq(5) | DBH | –5.11***±0.91 | 2.75***±0.28 | 89.44 | 0.348 | 0.318 | 12.54 | 1.062 | |
| D20 | –5.78***±1.10 | 2.82***±0.33 | 86.95 | 0.387 | 0.353 | 15.08 | 1.078 | ||
| CD | –0.74ns ±0.97 | 2.49***±0.54 | 64.93 | 0.634 | 0.579 | 26.94 | 1.223 | ||
| Eq(6) | DBH2×H | –5.58***±0.93 | 1.09***±0.11 | 90.10 | 0.337 | 0.308 | 11.77 | 1.058 | |
| DBH2×CD | –3.92**±0.95 | 0.93***±0.12 | 85.36 | 0.410 | 0.374 | 16.46 | 1.088 | ||
| D202×H | –6.18***±1.06 | 1.12***±0.12 | 88.67 | 0.360 | 0.329 | 13.38 | 1.067 | ||
| D202×CD | –4.37***±1.07 | 0.95***±0.13 | 83.71 | 0.432 | 0.395 | 17.74 | 1.098 | ||
| Eq(7) | DBH2×H; CD | –6.02***±1.20 | 1.23***±0.25 | –0.41ns ±0.66 | 89.44 | 0.348 | 0.301 | 13.28 | 1.062 |
| D202×H; CD | –6.56**±1.44 | 1.22**±0.28 | –0.30ns ±0.71 | 87.66 | 0.376 | 0.326 | 15.15 | 1.073 | |
| Branch biomass | |||||||||
| Eq(5) | DBH | –4.58***±0.85 | 2.80***±0.27 | 90.93 | 0.326 | 0.298 | 10.99 | 1.055 | |
| D20 | –5.32***±1.00 | 2.89***±0.29 | 89.49 | 0.351 | 0.321 | 12.75 | 1.064 | ||
| CD | –0.63ns ±0.66 | 2.83***±0.37 | 84.16 | 0.431 | 0.394 | 17.68 | 1.097 | ||
| Eq(6) | DBH2×H | –4.98***±0.94 | 1.11***±0.11 | 90.08 | 0.341 | 0.312 | 12.06 | 1.060 | |
| DBH2×CD | –3.63***±0.65 | 0.98***±0.08 | 93.30 | 0.280 | 0.256 | 07.35 | 1.040 | ||
| D202×H | –5.63***±1.03 | 1.14***±0.12 | 89.46 | 0.352 | 0.321 | 12.79 | 1.064 | ||
| D202×CD | –4.13***±0.73 | 1.00***±0.09 | 92.50 | 0.297 | 0.271 | 08.69 | 1.045 | ||
| Eq(7) | DBH2×H; CD | –3.77***±1.04 | 0.73***±0.22 | 1.10*±0.57 | 92.19 | 0.303 | 0.262 | 09.92 | 1.047 |
| D202×H; CD | –4.13**±1.19 | 0.74*±0.23 | 1.15ns ±0.59 | 91.80 | 0.310 | 0.269 | 10.52 | 1.049 | |
| Leaf biomass | |||||||||
| Eq(5) | DBH | –4.90***±1.07 | 2.23***±0.33 | 80.10 | 0.407 | 0.372 | 16.30 | 1.086 | |
| D20 | –5.31**±1.31 | 2.25***±0.38 | 74.64 | 0.459 | 0.419 | 19.19 | 1.111 | ||
| CD | –1.84*±0.66 | 2.29***±0.37 | 77.52 | 0.433 | 0.395 | 17.76 | 1.098 | ||
| Eq(6) | DBH2×H | –5.27***±1.11 | 0.89***±0.13 | 80.36 | 0.405 | 0.369 | 16.14 | 1.085 | |
| DBH2×CD | –4.18**±0.86 | 0.79***±0.10 | 83.41 | 0.372 | 0.339 | 14.11 | 1.072 | ||
| D202×H | –5.64**±1.30 | 0.89***±0.15 | 76.53 | 0.442 | 0.404 | 18.28 | 1.103 | ||
| D202×CD | –4.48**±1.01 | 0.79***±0.12 | 79.82 | 0.410 | 0.374 | 16.46 | 1.088 | ||
| Eq(7) | DBH2×H; CD | –4.11*±1.32 | 0.53*±0.28 | 1.05ns ±0.73 | 82.26 | 0.384 | 0.333 | 15.65 | 1.077 |
| D202×H; CD | –3.98*±1.57 | 0.45ns ±0.30 | 1.27ns ±0.77 | 79.97 | 0.408 | 0.354 | 17.11 | 1.087 | |
| Models selected as most appropriate are indicated in bold. | |||||||||
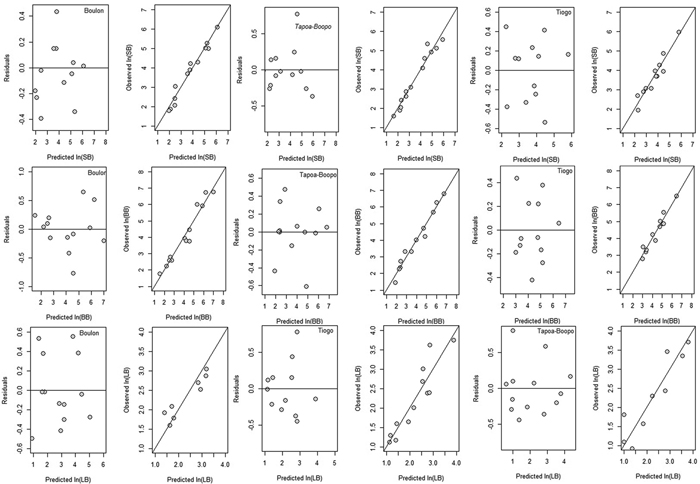
Fig. 2. Residuals and observed values versus predicted values of stem (SB), branch (BB) and leaf biomass (LB) for Boulon, Tapoa-Boopo and Tiogo forests, respectively. View larger in new window/tab.
| Table 4. Site-specific allometric equations for estimating aboveground biomass of Diospyros mespiliformis in Burkina Faso. ln(β0), β1 and γ represent the intercept and regression coefficients of the models, and their respective standard errors. The indicators of performance for the models include the adjusted coefficient of determination (Adj.R2), residual standard error (RSE), root mean squared error (RMSE), Akaike information criterion (AIC) and correction factor (CF). View in new window/tab. |
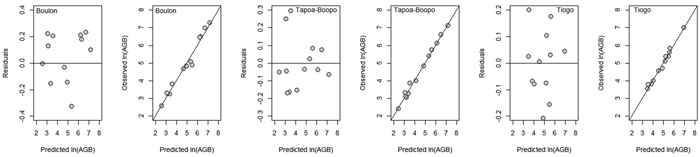
Fig. 3. Residuals and observed values versus predicted values of aboveground biomass (AGB) in Boulon, Tapoa-Boopo and Tiogo. View larger in new window/tab.
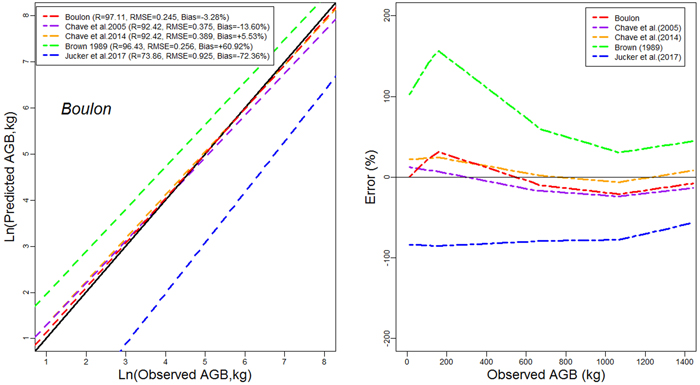
Fig. 4a. Comparison of models’ performances using the fitting dataset in Boulon. (left) Predicted and observed aboveground biomass values for the selected models. (right) Mean relative errors for the compared models across the observed aboveground biomass values. View larger in new window/tab.
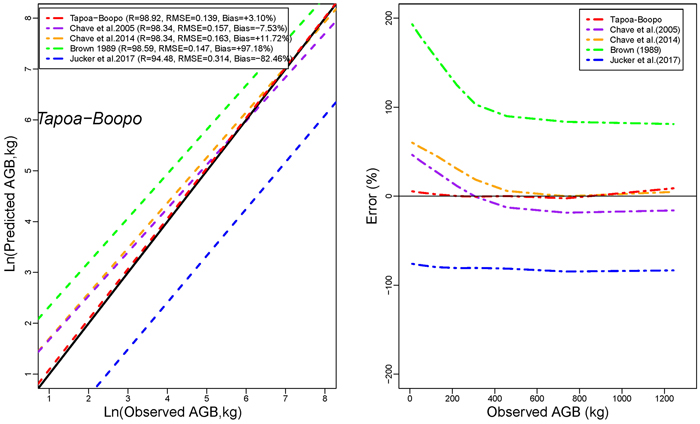
Fig. 4b. Comparison of models’ performances using the fitting dataset in Tapoa-Boopo. (left) Predicted and observed aboveground biomass values for the selected models. (right) Mean relative errors for the compared models across the observed aboveground biomass values. View larger in new window/tab.
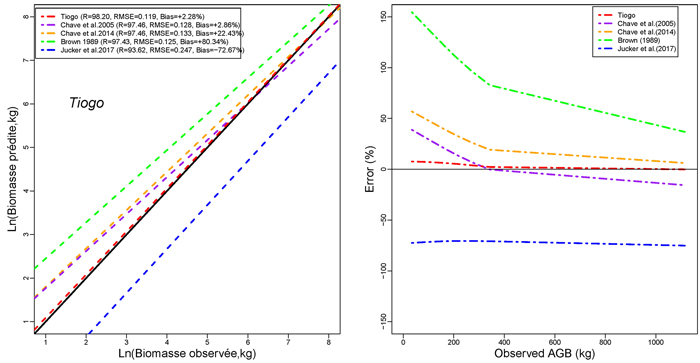
Fig. 4c. Comparison of models’ performances using the fitting dataset in Tiogo. (left) Predicted and observed aboveground biomass values for the selected models. (right) Mean relative errors for the compared models across the observed aboveground biomass values. View larger in new window/tab.
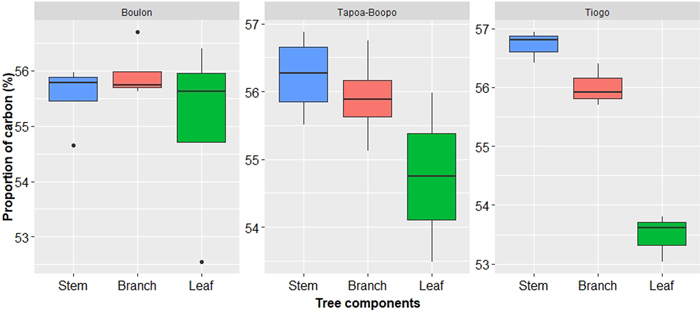
Fig. 5. Carbon content in Diospyros mespiliformis tree components (from 5 samples) in Boulon, Tapoa-Boopo and Tiogo forests.