| Table 1. Descriptive statistics of modeling data. The number of diameter increment measurements was 19 567 (two consecutive diameter measurements from the same tree), and the number of tree height measurements was 16 407. The number of plot level measurement intervals (two consecutive measurements of the same plot) was 129 and the number of plots was 47. | |||||
| Variables | N | Mean | Sdev | Minimum | Maximum |
| Diameter (cm) | 19 576 | 17.7 | 5.4 | 1.1 | 37.3 |
| Height (m) | 16 407 | 12.0 | 2.1 | 2.6 | 23.4 |
| Dominant height (m) | 129 | 11.7 | 2.3 | 7.2 | 19.4 |
| Age (year) | 129 | 37.7 | 9.0 | 17.0 | 50.0 |
| Stand basal area (m2 ha–1) | 129 | 22.9 | 8.3 | 5.4 | 48.5 |
| Number of trees per ha | 129 | 1175 | 910 | 231 | 3920 |
| Site index (m) | 129 | 12.8 | 2.3 | 10.3 | 17.2 |
| Sdev = standard deviation. | |||||
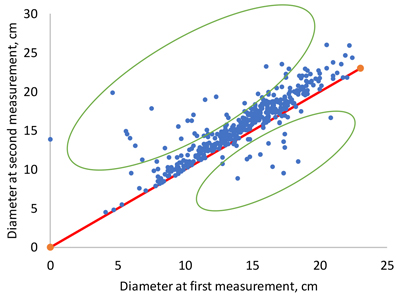
Fig. 1. Examples of unrealistically low or high diameter increments as a consequence of mistakes in tree numbering (dots within green ellipses).
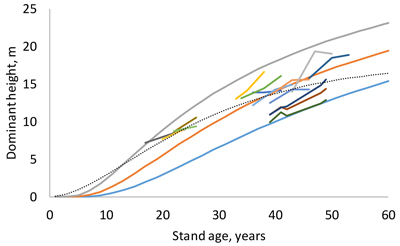
Fig. 2. Site index curves for site indices 10, 14 and 18 m and examples of measured sequences of age and dominant height (short lines). The dotted thin line is the guide curve of Jin et al. (2017).
| Table 2. Parameter estimates of the mixed-effects height model (Eq. 3). | |||
| Fixed parameter | Estimate | t value | |
| α0 | 9.645 | 11.556 | |
| α1 | 0.475 | 7.103 | |
| β0 | 9.110 | 10.995 | |
| β1 | –0.199 | –2.678 | |
| Random parameter | Sdev | Correlations | |
| α0j | 3.460 | α0j | α1j |
| α1j | 0.264 | –0.885 | |
| β1j | 0.173 | 0.008 | 0.382 |
| Sdev = standard deviation. | |||
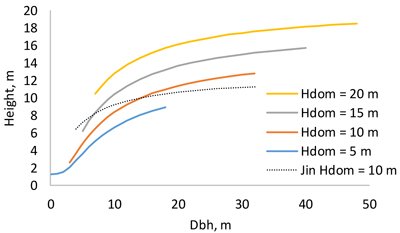
Fig. 3. Dependence of tree height on breast height diameter at different dominant heights. The thin dotted line is the model of Jin et al. (2017) for dominant height 10 m.
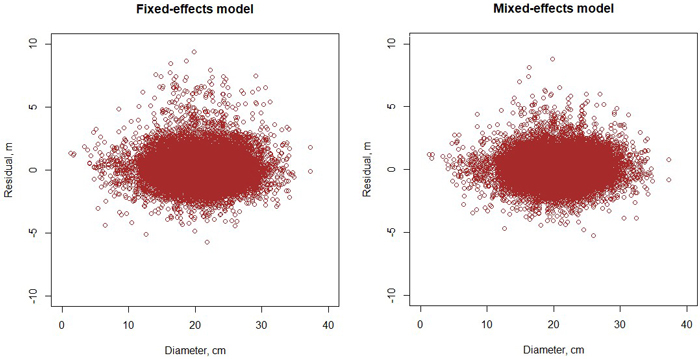
Fig. 4. Residuals of the fixed-effects (left) and mixed-effects (right) height model.
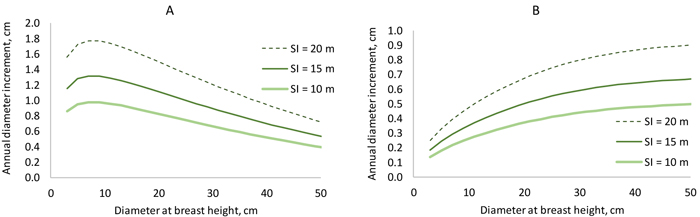
Fig. 5. Diameter increment model. On the left, stand basal area increases from 6 to 30 m2 ha–1 when diameter increases from 3 to 5 cm (BAL = 0.3×G). On the right, basal area is constant (25 m2 ha–1), and BAL decreases from 25 to 6 m2 ha–1 when diameter increases from 3 to 50 cm. View larger in new window/tab
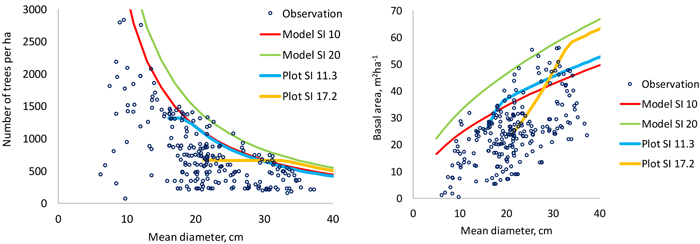
Fig. 6. Data points used to model the 95% quantile of number of trees per hectare (left) and stand basal area (right). The thin continuous lines are model predictions for two site indices and the thicker lines are simulations made for two plots using the models developed in this study. The plot shown with blue line (SI 11.3) is the only non-thinned permanent plot in the modeling data of this study. View larger in new window/tab
| Table 3. Bootstrapping results for diameter increment and survival modeling. The results are based on 60 optimization-based model fittings but the ratio between mean value of the coefficient and its standard deviation is also shown for 30 model fittings (30 MF). The dataset in each fitting was a random sample of the data. Random sampling with replacement was used. | ||||||||||
| Variable | Diameter increment model | Survival model | ||||||||
| Min | Max | Mean | Mean/Sdev | Min | Max | Mean | Mean/Sdev | |||
| 60 MF | 30 MF | 60 MF | 30 MF | |||||||
| Constant | 0.498 | 1.099 | 0.627 | 5.452 | 4.915 | –0.645 | 1.689 | 0.525 | 1.036 | 0.859 |
| ln(d) | 0.446 | 0.531 | 0.498 | 29.092 | 26.872 | 2.010 | 3.608 | 2.935 | 9.685 | 8.874 |
| (d/10)2 | –0.020 | –0.011 | –0.015 | –6.101 | –6.210 | –0.498 | –0.137 | –0.365 | –4.525 | –4.435 |
| ln(G) | –0.938 | –0.876 | –0.909 | –77.286 | –75.768 | - | - | - | - | - |
| ln(BAL+1) | –0.249 | –0.228 | –0.235 | –43.483 | –38.963 | –0.920 | –0.200 | –0.594 | –3.268 | –3.285 |
| SI | 0.040 | 0.062 | 0.057 | 12.907 | 11.857 | 0.011 | 0.118 | 0.062 | 2.565 | 2.765 |
| d is diameter at the breast (cm); G is stand basal area (m2 ha–1); BAL is basal area in large trees (m2 ha–1); SI is site index (m); Sdev is standard deviation. | ||||||||||
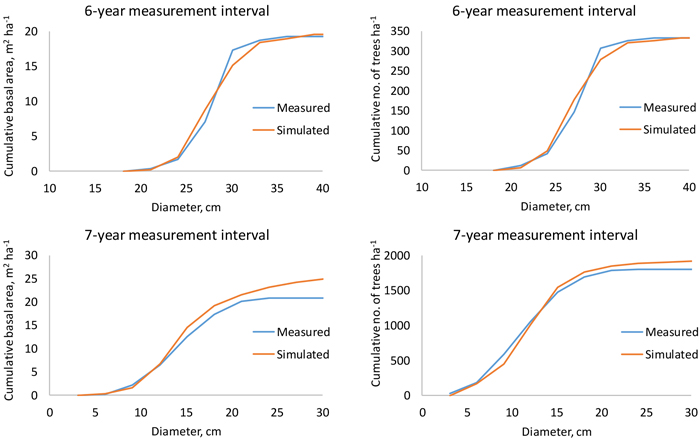
Fig. 7. Measured and simulated cumulative stand basal area (left) and number of trees per hectare (right) in a 48-year-old (top) and 24-year-old (bottom) plantation when the measurement interval is 6 or 7 years.
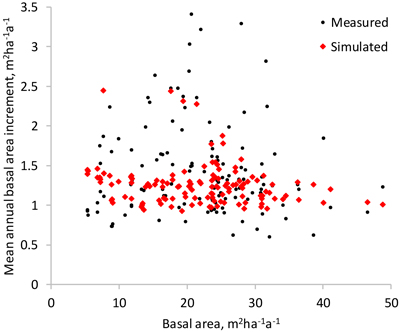
Fig. 8. Measured and simulated mean annual basal area increment of the study plots (the difference of the basal area in the beginning and at the end of the measurement interval divided by the length of the interval).
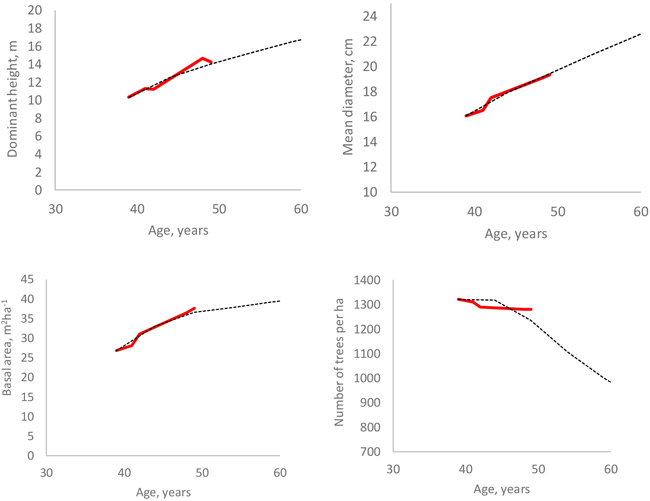
Fig. 9. Measured (red line) and simulated (black dotted line) development of four stand attributes in a non-thinned plot.