| Table 1. Number of planting sites in different planting seasons, by tree species and geographical region. Areas were classified into two groups based on accumulated temperature sums: central Finland 1000–1200 d.d. and southern Finland >1200 d.d. (Äijälä et al. 2014). |
| Region/ | Norway spruce | Scots pine |
| Planting season | Central | Southern | Central | Southern |
| Spring | 243 | 475 | 134 | 198 |
| Summer | 62 | 24 | 12 | 10 |
| Autumn | 39 | 43 | 13 | 17 |
| Table 2. Average weather data for two geographical sub-regions (central [N = 6], southern [N = 7]) in Finland. Pmean – mean precipitation sum (mm), with the average of 1981–2010 in brackets; Tmean – mean temperature (°C), with the average of 1981–2010 in brackets; Tmin – mean minimum temperature (°C); Tmax – mean maximum temperature (°C). April, May and June were included in the spring plantings, July and August in the summer plantings, and September and October in the autumn plantings. |
| Region | Planting time | Pmean | Tmean | Tmin | Tmax |
| Central Finland | Spring | 51 (36) | 10 (8) | –2 | 22 |
| Summer | 111 (68) | 16 (15) | 5 | 25 |
| Autumn | 28 (52) | 7 (6) | –2 | 16 |
| Southern Finland | Spring | 49 (34) | 11 (9) | –1 | 23 |
| Summer | 80 (67) | 16 (16) | 6 | 25 |
| Autumn | 32 (58) | 7 (8) | –2 | 18 |
| Table 3. Range of viable seedling density per hectare for the corresponding grade based on target density. |
| Tree species Target, seedlings/ha | Grade, seedlings/ha |
| Excellent | Good | Moderate | Weak |
| Scots pine | 2500 | ≥ 2375 | 2374–2125 | 2124–1300 | 1299 ≥ |
| Scots pine | 2200 | ≥ 2090 | 2089–1870 | 1869–1300 | 1299 ≥ |
| Scots pine | 2000 | ≥ 1900 | 1899–1700 | 1699–1300 | 1299 ≥ |
| Norway spruce | 2000 | ≥ 1900 | 1899–1700 | 1699–1200 | 1199 ≥ |
| Norway spruce | 1800 | ≥ 1710 | 1709–1530 | 1529–1200 | 1199 ≥ |
| Norway spruce | 1600 | ≥ 1520 | 1519–1360 | 1359–1200 | 1199 ≥ |
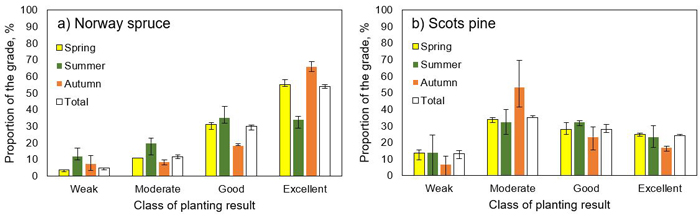
Fig. 1. Proportion of all Norway spruce (a) and Scots pine (b) plantings in different planting-result classes (weak, moderate, good, excellent), given overall (total) and separately for different planting seasons (spring, summer, autumn). Error bars show the range of proportions between southern and central Finland.
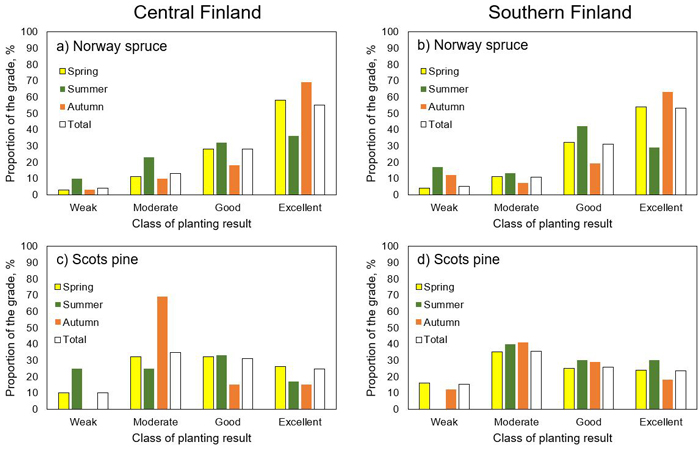
Fig. 2. Proportion of Norway spruce (a, b) and Scots pine (c, d) sites in different planting-result classes (weak, moderate, good, excellent), given overall (total) and separately for different planting seasons (spring, summer, autumn) in central (a, c) and southern (b, d) Finland.
| Table 4. Binary logistic regression model for the probability of a successful planting result. The modeling data consist of 1270 planting sites in southern and central Finland. Exponentiated estimate denotes the odds ratio. |
| 95% C.I. for Exp(B) |
| Variable | Estimate | Std. Err | p-value | Odds ratio | Lower | Upper |
| Intercept | 1.713 | 0.115 | 0.000 | | | |
| Tree species (ref. Norway spruce) |
| Scots pine | –1.668 | 0.153 | 0.000 | 0.189 | 0.140 | 0.255 |
| Planting time (ref. spring) |
| Autumn | –0.117 | 0.321 | 0.716 | 0.890 | 0.474 | 1.669 |
| Summer | –1.044 | 0.262 | 0.000 | 0.352 | 0.211 | 0.588 |
| Region (ref. south) |
| Central | 0.159 | 0.143 | 0.268 | 1.172 | 0.885 | 1.552 |
| Interaction (ref. spring Norway spruce) |
| Summer Scots pine | 1.096 | 0.512 | 0.032 | 2.992 | 0.249 | 1.795 |
| Autumn Scots pine | –0.403 | 0.504 | 0.424 | 0.669 | 1.096 | 8.163 |
| Table 5. Accuracy of classification of the planting results. |
| Observed | Predicted | Percent Correct |
| Poor | Successful |
| Poor | 18 | 312 | 5.5% |
| Successful | 12 | 928 | 98.7% |
| Overall percentage | 2.4% | 97.6% | 74.5% |
| Table 6. The numbers and proportions (%) of poor planting results, due to poor work quality and natural causes of damage, in different planting seasons for Norway spruce and Scots pine. The “mammals and birds” category includes moose, deer, bird, vole and hare damage. Other reason category includes reduced planting quality due to excessive vegetation, overwatering of the soil, rocky terrain or other terrain-related difficulties and the unknown reason category includes invalid or unclear reasons for poor plantings, respectively. |
Reason for poor
planting result | Norway spruce | Scots pine |
| Spring | Summer | Autumn | Total | Spring | Summer | Autumn | Total |
| Planting mistake | 15 (14%) | 3 (11%) | 2 (14%) | 20 (13%) | 14 (9%) | 0 (0%) | 1 (6%) | 15 (8%) |
| Poor soil scarification | 29 (27%) | 6 (22%) | 1 (7%) | 36 (24%) | 14 (9%) | 3 (30%) | 5 (28%) | 22 (12%) |
| Poor seedling material | 1 (1%) | 0 (0%) | 0 (0%) | 1 (1%) | 0 (0%) | 0 (0%) | 0 (0%) | 0 (0%) |
| Insects | 5 (5%) | 5 (19%) | 0 (0%) | 10 (7%) | 6 (4%) | 1 (10%) | 2 (11%) | 9 (5%) |
| Mammals and birds | 8 (7%) | 1 (4%) | 2 (14%) | 11 (7%) | 63 (40%) | 1 (10%) | 2 (11%) | 66 (36%) |
| Fungi | 0 (0%) | 0 (0%) | 0 (0%) | 0 (0%) | 2 (1%) | 0 (0%) | 0 (0%) | 2 (1%) |
| Frost | 2 (2%) | 0 (0%) | 5 (36%) | 7 (5%) | 2 (1%) | 1 (9%) | 3 (17%) | 6 (3%) |
| Drought | 2 (2%) | 0 (0%) | 2 (14%) | 4 (3%) | 3 (2%) | 0 (0%) | 0 (0%) | 3 (2%) |
| Other reason | 15 (14%) | 4 (15%) | 0 (0%) | 19 (13%) | 15 (10%) | 1 (10%) | 2 (11%) | 18 (10%) |
| Unknown reason | 31 (29%) | 8 (30%) | 2 (14%) | 41 (28%) | 38 (24%) | 3 (30%) | 3 (17%) | 44 (24%) |