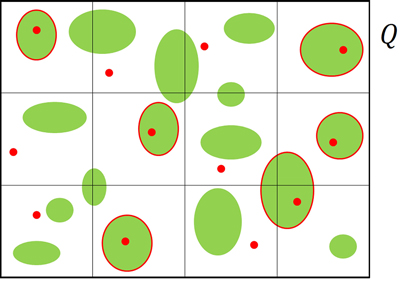
Fig. 1. Example of a population of tree plantations sampled by means of tessellation stratified sampling. The region Q is tessellated by 12 quadrats, the green ellipses represent plantations and the red points represent sample points. Plantations encircled in red are those selected in the first phase.
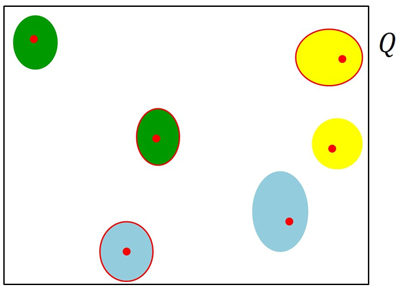
Fig. 2. Example of the stratified second-phase sampling. The six plantations selected in the first phase are partitioned into three strata (yellow, green and light blue plantations) and the 50% is selected from each stratum. Plantations encircled in red are those selected in the second phase.
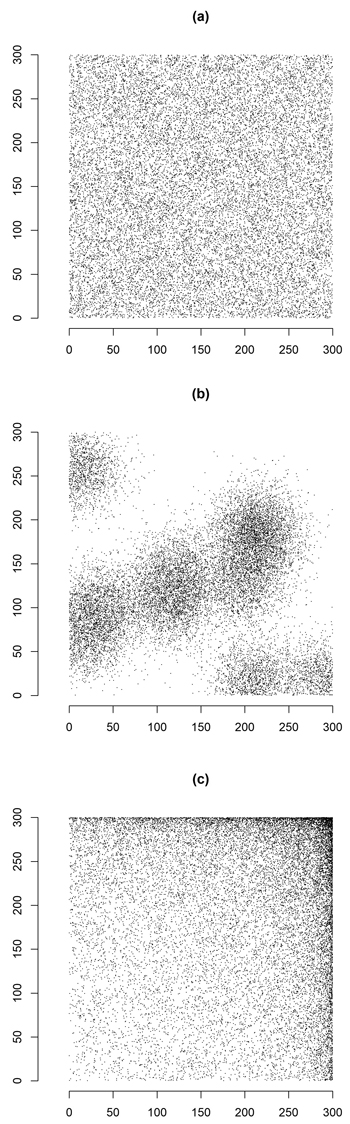
Fig. 3. Spatial distribution of populations of N = 20 000 circular poplar plantations artificially generated from random (a), clustered (b) and trended (c) spatial patterns.
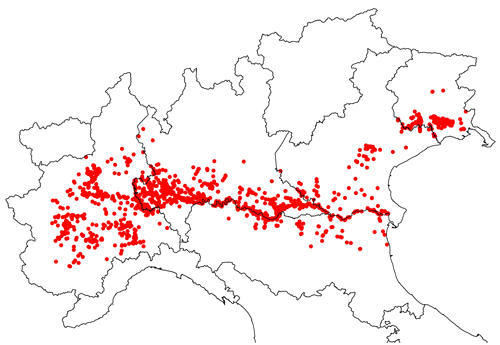
Fig. 4. Distribution of the 1736 sampling points falling in poplar plantations across the Padan Plain (Northern Italy).
| Table 1. Vegetation indices derived from ESA Sentinel-2 satellite mission. | |||
| Vegetation index | Abbreviation | Formula | Reference |
| Simple Ratio 800/2170 | SR | Malthus et al. (1993) | |
| Mid-infrared Vegetation Index | MVI | Thenkabail et al. (2002) | |
| Normalized Difference Red Edge | NDRE | Hunt et al. (2011) | |
| Normalized Difference Vegetation Index | NDVI | Rouse et al. (1973) | |
| Normalized Difference Moisture Index | NDMI | Wilson and Sader (2002) | |
| Normalized Burn Ratio | NBR | Key and Benson (2005) | |
| Atmospherically Resistant Vegetational Index | ARVI | Thenkabail et al. (2002) | |
| Table 2. Relative bias (RB), relative root mean squared error (RRMSE), expectation of the relative standard error estimator (ERSEE) and actual coverage of the nominal 95% confidence intervals (AC95) of first-phase coverage estimator, second-phase estimator based on the sole sample information and second-phase linear regression estimator of wood volume for the three artificial populations of poplar plantations with random, clustered, and trended spatial distributions. | ||||
| Estimated attribute | Performance indexes | Random | Clustered | Trended |
| coverage | RB (%) | 0.05 | 0.06 | 0.01 |
| RRMSE (%) | 2.83 | 3.05 | 2.89 | |
| ERSEE (%) | 2.94 | 3.22 | 3.07 | |
| AC95(%) | 96.11 | 96.50 | 96.39 | |
| wood volume (sole sample information) | RB (%) | –2.46 | –2.06 | –2.10 |
| RRMSE (%) | 9.35 | 8.01 | 7.72 | |
| ERSEE (%) | 9.34 | 8.04 | 7.64 | |
| AC95(%) | 93.32 | 93.42 | 93.14 | |
| wood volume (linear regression estimator) | RB (%) | –2.54 | –2.18 | –2.16 |
| RRMSE (%) | 7.97 | 6.97 | 6.59 | |
| ERSEE (%) | 7.63 | 6.73 | 6.33 | |
| AC95(%) | 92.15 | 92.37 | 92.57 | |
| Table 3. Pearson correlation coefficient between wood volume of poplar plantations and vegetation indices from Sentinel-2 imagery. | |
| Vegetation index (see Table 1) | Pearson coefficient |
| SR | 0.63 |
| MVI | 0.62 |
| NDRE | 0.60 |
| NDVI | 0.59 |
| NDMI | 0.59 |
| NBR | 0.59 |
| ARVI | 0.58 |