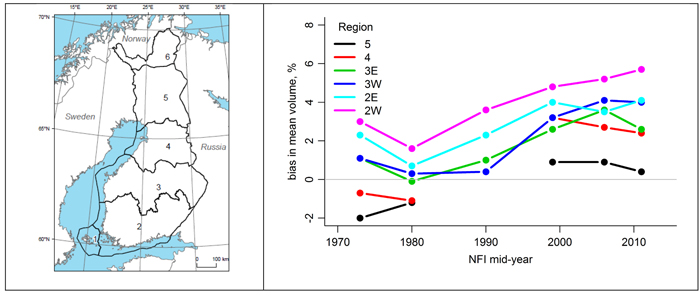
Fig. 1. The difference between the predictions of the two volume models from the 1970s to the 2010s (right) by the National Forest Inventory of Finland (NFI) sampling region (left). Sampling regions 2 and 3 are divided into western (W) and eastern (E) parts.
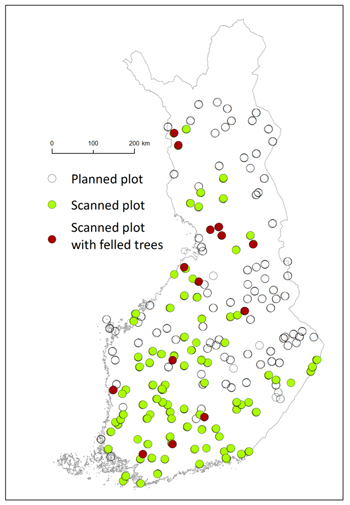
Fig. 2. The plots selected for TLS data collection (all dots), scanned plots (green dots), felled trees (red dots).
| Table 1. The minimum, maximum and mean of diameter at breast height (dbh), height (h) and volume (v) in the old and new volume modelling data by tree species. | |||||||
| old data | new data | ||||||
| min | max | mean | min | max | mean | ||
| pine | dbh (cm) | 0.90 | 50.60 | 20.23 | 3.90 | 49.70 | 20.90 |
| h (m) | 1.50 | 28.30 | 13.67 | 5.40 | 29.60 | 16.59 | |
| v (dm3) | 0.40 | 1921 | 312 | 5.10 | 1947.7 | 340.20 | |
| spruce | dbh (cm) | 1.5 | 61.9 | 18.04 | 5.55 | 57.00 | 22.25 |
| h (m) | 1.8 | 32.7 | 13.82 | 4.50 | 32.70 | 18.19 | |
| v (dm3) | 0.7 | 3796 | 264 | 7.40 | 2856.4 | 448.20 | |
| birch | dbh (cm) | 1.2 | 49.7 | 16.65 | 4.00 | 42.45 | 16.18 |
| h (m) | 2.4 | 29.5 | 15.33 | 4.50 | 29.80 | 16.20 | |
| v (dm3) | 0.4 | 2026 | 229 | 4.30 | 1427.70 | 213.36 | |
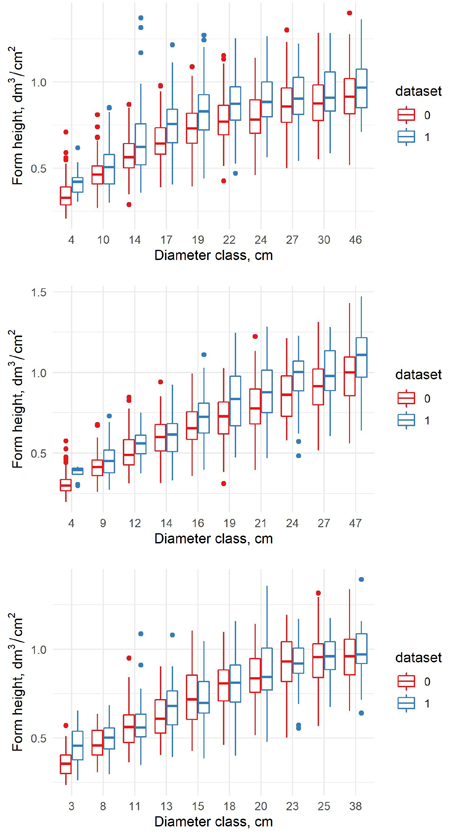
Fig. 3. The form height in old (0) and new (1) dataset for pine (upper) spruce (middle) and birch (lower) in the percentile diameter classes.
| Table 2. The estimates of coefficients of the volume model 5 (61.1. in Laasasenaho 1982), their standard error and t-values for all species | |||||
| full data model | old model | ||||
| coefficient | standard error | t-value | coefficient | ||
| pine | β0 | –2.293114 | 0.0228019 | –101.3275 | –2.29450 |
| β1 | 2.570253 | 0.007707629 | 333.4687 | 2.57025 | |
| δ0 | 0.2105365 | 0.05147734 | 4.089886 | ||
| δ1 | –0.03352298 | 0.01723158 | –1.945438 | ||
| spruce | β0 | –2.411956 | 0.02326293 | –104.5267 | –2.41218 |
| β1 | 2.624621 | 0.008255297 | 317.9317 | 2.62463 | |
| δ0 | 0.06596944 | 0.06211427 | 1.062066 | ||
| δ1 | 0.009008474 | 0.0206251 | 0.4367724 | ||
| birch | β0 | –2.102088 | 0.03392367 | –62.55514 | –2.09787 |
| β1 | 2.55162 | 0.01231355 | 207.2205 | 2.55058 | |
| δ0 | 0.1252633 | 0.06947937 | 1.802885 | ||
| δ1 | –0.03105756 | 0.02547401 | –1.219186 | ||
| Table 3. The residual standard error (RSE) and the coefficient of determination (Multiple R2) for old and new volume models (5) by species. The F-test describes the significance of the full model compared to the old model. | ||||||||
| Tree species | Full data | Old data | ||||||
| RSE original | RSE | Multiple R2 | F-test | p-value | RSE original | RSE | Multiple R2 | |
| Pine | 19.51 | 19.45 | 0.9792 | 115.36 | 0 | 18.01 | 17.81 | 0.9833 |
| Spruce | 20.41 | 20.93 | 0.9811 | 48.768 | 0 | 19.91 | 20.77 | 0.9823 |
| Birch | 20.30 | 19.88 | 0.9792 | 6.1824 | 0.002 | 20.08 | 19.66 | 0.9812 |
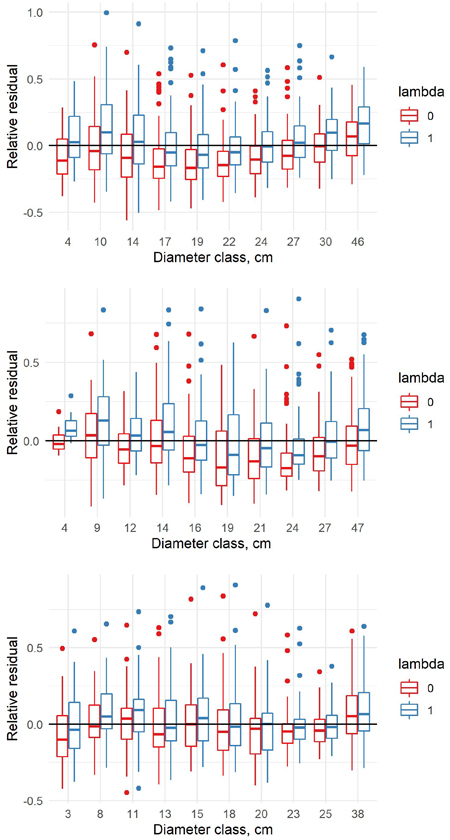
Fig. 4. Relative residuals of model 5 in the dbh classes of the new data with λ = 0 and λ = 1 for pine (upper row), spruce (middle row) and birch (lower row).
| Table 4. The estimates of coefficients of the volume model 6 (61.2. in Laasasenaho 1982), their standard error and t-values for all species | |||||
| full data model | old model | ||||
| coefficient | standard error | t-value | coefficient | ||
| pine | β0 | –5.392811 | 0.06715021 | –80.54965 | –5.39417 |
| β1 | 3.480598 | 0.03040095 | 114.4898 | 3.48060 | |
| β2 | –0.03198842 | 0.001596443 | –20.03731 | –0.039884 | |
| δ0 | –0.002811802 | 0.1647923 | –0.0170627 | ||
| δ1 | 0.06637664 | 0.07175107 | 0.9250962 | ||
| δ2 | –0.005370931 | 0.003522453 | –1.52477 | ||
| spruce | β0 | –5.398914 | 0.06499235 | –83.34407 | –5.39934 |
| β1 | 3.46464 | 0.03031531 | 114.2868 | 3.46468 | |
| β2 | –0.02731815 | 0.001716997 | –15.91042 | –0.0273199 | |
| δ0 | –0.4109449 | 0.2124345 | –1.934454 | ||
| δ1 | 0.2087533 | 0.08939057 | 2.335294 | ||
| δ2 | –0.00843131 | 0.004000025 | –2.107814 | ||
| birch | β0 | –5.327978 | 0.08839265 | –60.48643 | –5.41948 |
| β1 | 3.546208 | 0.04242831 | 83.58118 | 3.57630 | |
| β2 | –0.03882196 | 0.002573179 | –15.08716 | –0.0395855 | |
| δ0 | –5.327978 | 0.08839265 | –60.48643 | ||
| δ1 | 3.546208 | 0.04242831 | 83.58118 | ||
| δ2 | –0.03882196 | 0.002573179 | –15.08716 | ||
| Table 5. The residual standard error (RSE) and the coefficient of determination (Multiple R2) for old and new volume models (6) by species. The F-test describes the significance of the full model compared to the old model. | ||||||||
| Tree species | Full data | Old data | ||||||
| RSE original | RSE | Multiple R2 | F-test | p-value | RSE original | RSE | Multiple R2 | |
| Pine | 18.09 | 17.77 | 0.9807 | 69.078 | 0 | 17.30 | 17.04 | 0.9846 |
| Spruce | 19.04 | 18.45 | 0.9829 | 38.97 | 0 | 18.86 | 18.42 | 0.9841 |
| Birch | 19.27 | 18.54 | 0.9811 | 8.3378 | 0 | 18.89 | 18.08 | 0.9834 |
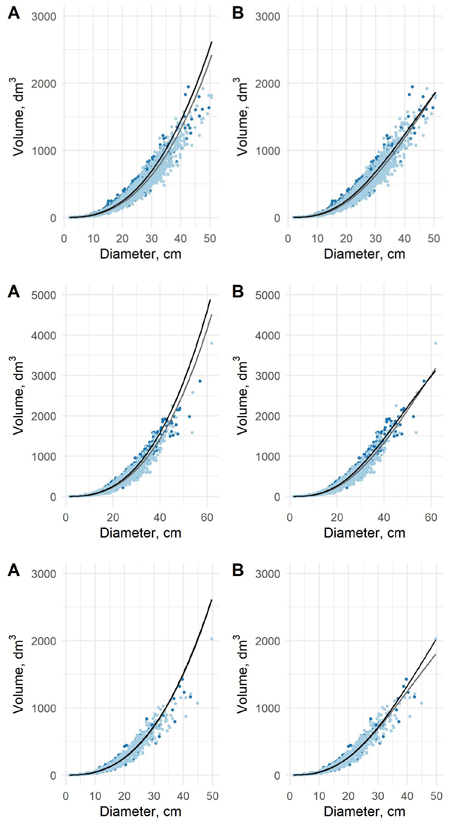
Fig. 5. The predicted tree volumes as a function of dbh in old data (light blue dots) and new data (blue dots) for pine (upper), spruce (middle) and birch (lower) using model 5 (A) and model 6 (B). Black curve is based on new data and grey on the old data.
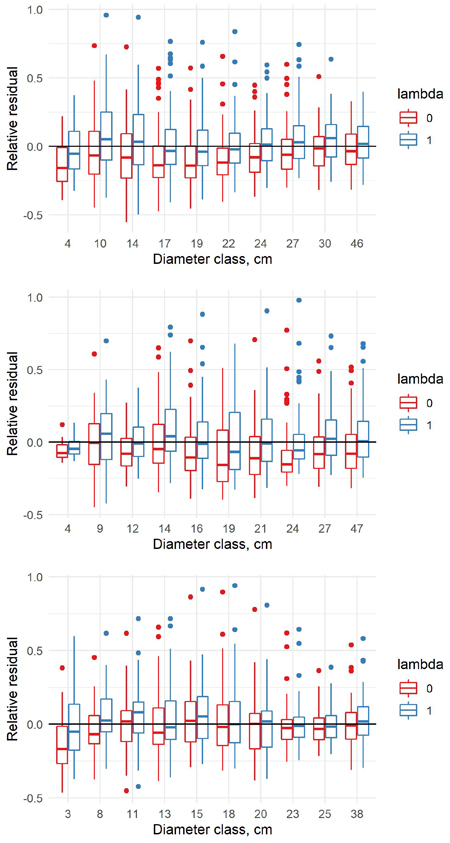
Fig. 6. Relative residuals of model 6 in the dbh classes of the new data with λ = 0 and λ = 1 for pine (upper row), spruce (middle row) and birch (lower row).
| Table 6. The estimates of coefficients of the volume model 7 (61.3. in Laasasenaho 1982), their standard error and t-values for all species. | |||||
| full data model | old model | ||||
| coefficient | standard error | t-value | coefficient | ||
| pine | β0 | –3.383341 | 0.04207626 | –80.45867 | –3.32176 |
| β1 | 2.015408 | 0.01445914 | 139.3864 | 2.01395 | |
| β2 | 2.144271 | 0.05597404 | 38.30831 | 2.07025 | |
| β3 | –1.121108 | 0.04888704 | –22.93263 | –1.07209 | |
| β4 | –0.004035521 | 0.0006782147 | –5.950211 | –0.003273 | |
| δ0 | 0.5831496 | 0.1432678 | 4.070347 | ||
| δ1 | –0.1778505 | 0.03040952 | –5.848513 | ||
| δ2 | –1.1444 | 0.2984041 | –3.835067 | ||
| δ3 | 1.141898 | 0.2689587 | 4.245627 | ||
| δ4 | 0.002406294 | 0.001429594 | 1.683201 | ||
| spruce | β0 | –3.782985 | 0.04199002 | –90.15069 | –3.77543 |
| β1 | 1.912913 | 0.01687974 | 113.326 | 1.91505 | |
| β2 | 2.833072 | 0.04900075 | 57.81691 | 2.82541 | |
| β3 | –1.538206 | 0.04188057 | –36.7284 | –1.53547 | |
| β4 | –0.008581622 | 0.0008074753 | –10.62772 | –0.0085726 | |
| δ0 | 0.03531895 | 0.1722487 | 0.2050462 | ||
| δ1 | –0.0461456 | 0.04193549 | –1.100395 | ||
| δ2 | 0.1403905 | 0.3540179 | 0.3965632 | ||
| δ3 | –0.1161943 | 0.3197521 | –0.3633886 | ||
| δ4 | 0.0003250218 | 0.001790375 | 0.1815384 | ||
| birch | β0 | –4.553696 | 0.08843668 | –51.52675 | –4.49213 |
| β1 | 2.122157 | 0.02553022 | 83.12333 | 2.10253 | |
| β2 | 4.096565 | 0.1526368 | 26.83864 | 3.98519 | |
| β3 | –2.767257 | 0.1362035 | –20.31707 | –2.65900 | |
| β4 | –0.01485222 | 0.001453626 | –10.21736 | –0.0140970 | |
| δ0 | 0.4878564 | 0.2303936 | 2.117491 | ||
| δ1 | –0.2301959 | 0.04762161 | –4.833855 | ||
| δ2 | –0.5090479 | 0.5184651 | –0.9818365 | ||
| δ3 | 0.4926584 | 0.4648618 | 1.059795 | ||
| δ4 | 0.01209118 | 0.002811613 | 4.300443 | ||
| Table 7. The residual standard error (RSE) and the coefficient of determination (Multiple R2) for old and new volume models (7) by species. The F-test describes the significance of the full model compared to the old model. | ||||||||
| Tree species | Full data | Old data | ||||||
| RSE original | RSE | Multiple R2 | F-test | p-value | RSE original | RSE | Multiple R2 | |
| Pine | 6.42 | 6.42 | 0.9975 | 32.933 | 0 | 6.82 | 6.81 | 0.9976 |
| Spruce | 7.00 | 6.97 | 0.9977 | 7.7947 | 0 | 7.46 | 7.42 | 0.9975 |
| Birch | 7.96 | 7.88 | 0.9967 | 10.531 | 0 | 8.13 | 7.98 | 0.9969 |
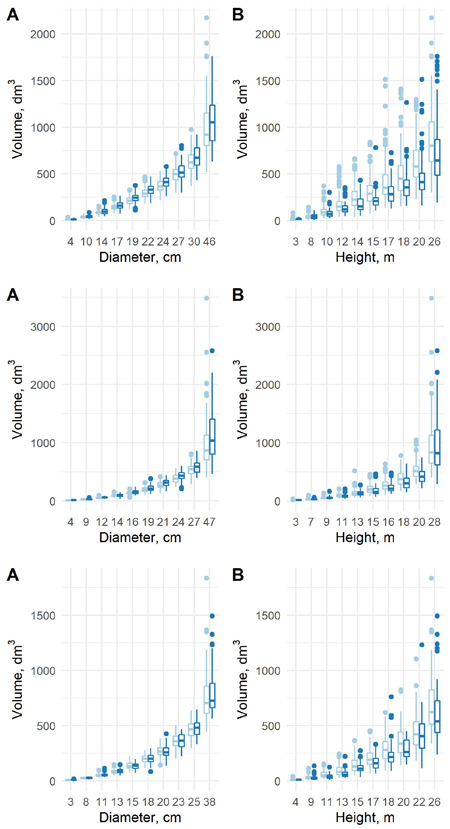
Fig. 7. The predicted tree volumes using model 7 in the old data (light blue) and new data (blue) as a function of dbh class (A) and h class (B) for pine (upper row), spruce (middle row) and birch (lower row).
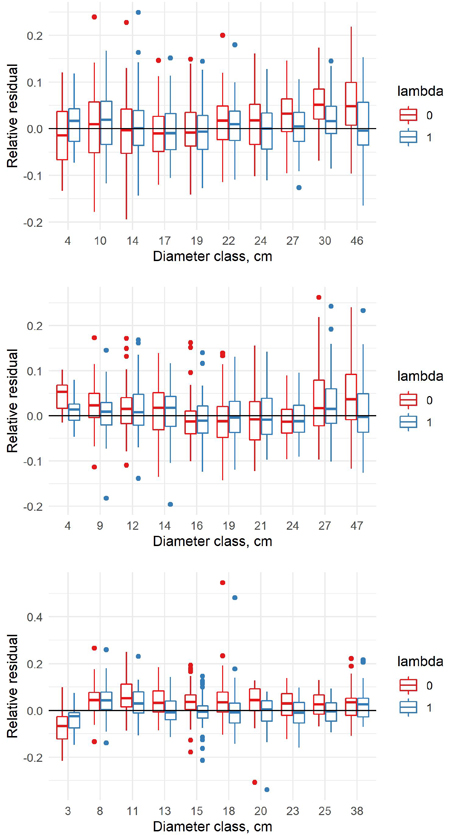
Fig. 8. Relative residuals of model 7 in the dbh classes of the new data with λ = 0 and λ = 1 for pine (upper row), spruce (middle row) and birch (lower row).
| Table 8. The coefficients, their standard errors and t-values of the new volume model (8) for all species. | ||||
| full data model | ||||
| coefficient | standard error | t-value | ||
| pine | β0 | –4.447527 | 0.02631802 | –169.0749 |
| β1 | 2.362339 | 0.01531425 | 154.2575 | |
| β2 | –0.01054031 | 0.0006214953 | –16.9596 | |
| β3 | 0.8566598 | 0.007997866 | 107.111 | |
| δ0 | –0.05472306 | 0.06228864 | –0.87854 | |
| δ1 | –0.1009865 | 0.03211809 | –3.144226 | |
| δ2 | –0.002319712 | 0.001344036 | –1.72593 | |
| δ3 | 0.1566015 | 0.01423715 | 10.9995 | |
| spruce | β0 | –4.162928 | 0.03039662 | –137.0555 |
| β1 | 2.083863 | 0.01977891 | 105.3578 | |
| β2 | –0.00527749 | 0.0007558304 | –6.982374 | |
| β3 | 1.040583 | 0.0114666 | 90.74904 | |
| δ0 | –0.207592 | 0.09298762 | –2.232469 | |
| δ1 | 0.007377705 | 0.04845477 | 0.1522596 | |
| δ2 | –0.005278365 | 0.001738939 | –3.035395 | |
| δ3 | 0.1034346 | 0.02262765 | 4.57116 | |
| birch | β0 | –5.12979 | 0.04217144 | –121.7211 |
| β1 | 2.509713 | 0.02722397 | 92.18763 | |
| β2 | –0.02113233 | 0.001285776 | –16.43546 | |
| β3 | 0.9830402 | 0.01676183 | 58.64755 | |
| δ0 | 0.2926902 | 0.09660794 | 3.02967 | |
| δ1 | –0.2129817 | 0.05494384 | –3.876353 | |
| δ2 | 0.009456602 | 0.002737932 | 3.453922 | |
| δ3 | 0.06331147 | 0.02997322 | 2.112268 | |
| Table 9. The residual standard error (RSE) and the coefficient of determination (Multiple R2) for old and new volume models (8) by species. The F-test describes the significance of the full model compared to the old model. | |||||
| Tree species | Full data | ||||
| RSE original | RSE | Multiple R2 | F-test | p-value | |
| Pine | 6.62 | 6.67 | 0.9974 | 41.096 | 0 |
| Spruce | 7.88 | 8.13 | 0.9970 | 12.158 | 0 |
| Birch | 8.22 | 8.19 | 0.9965 | 9.1126 | 0 |
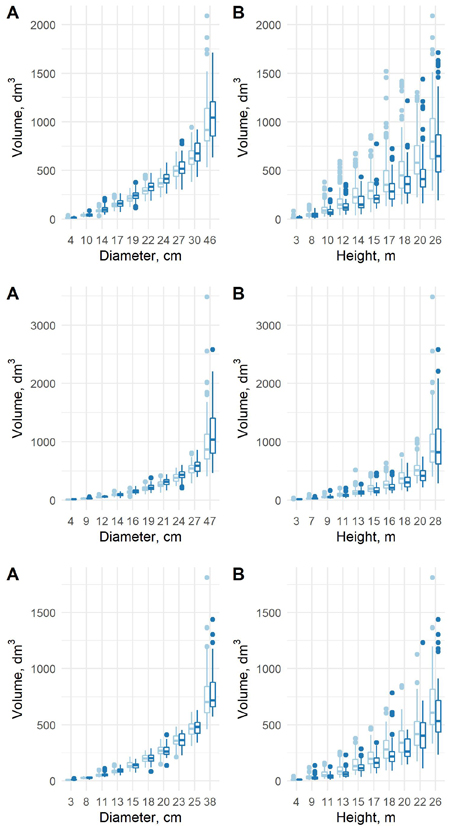
Fig. 9. The predicted tree volumes with the new model 8 in the old data (light blue) and new data (blue) as a function of dbh class (A) and h class (B) for pine (upper row), spruce (middle row) and birch (lower row).
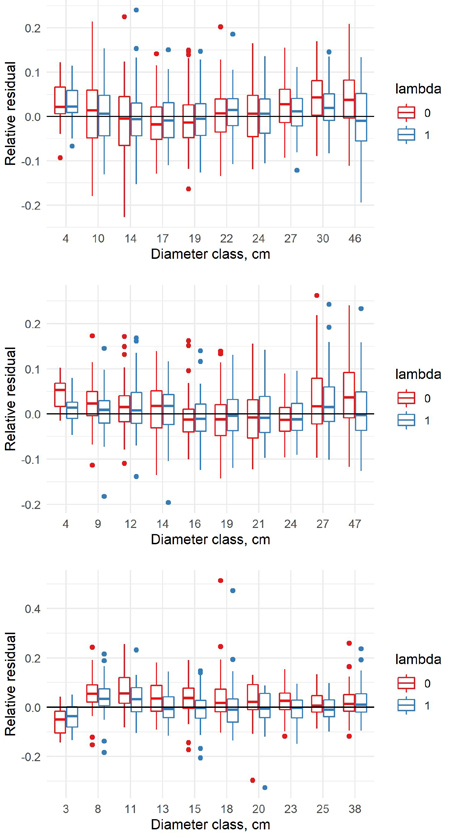
Fig. 10. Relative residuals of model 8 in the dbh classes of the new data with λ = 0 and λ = 1 for pine (upper row), spruce (middle row) and birch (lower row).