| Table 1. List of symbols and abbreviations. Only unprimed symbols, representing the reflectance sphere, are given here. Corresponding primed symbols refer to the same quantities in the transmittance sphere. | |
| Symbol | Explanation |
| P | Detected power in the sample measurement |
| P(SPC) | Detected power when the sample port is covered by white reference panel (Spectralon) |
| P(0) | Detected power in an empty sphere |
| Pin | Incoming power |
| δ | Fraction of the sphere inner surface area taken up by the detector |
| s | Fraction of the sphere inner surface area taken up by the sample port |
| h | Fraction of the sphere inner surface area taken up by the other ports |
| α | Fraction of the sphere inner surface area not taken up by ports |
| m | Reflectance of the sphere coating |
| r | Reflectance of the other ports |
| f | Fraction of sphere inner surface seen by the detector |
| Rc | Specular reflectance for collimated light beam incident upon the sample |
| Rcd, Rcd,0 | Diffuse reflectance for collimated light beam incident upon the sample (with/without carrier) |
| Rd, Rd,0 | Diffuse reflectance for diffuse light incident upon the sample (with/without carrier) |
| RSPC | Reflectance of white reference panel (Spectralon) |
| Tc | Direct transmittance for collimated light beam incident upon the sample |
| Tcd, Tcd,0 | Diffuse transmittance for collimated light beam incident upon the sample (with/without carrier) |
| Td, Td,0 | Diffuse transmittance for diffuse light incident upon the sample (with/without carrier) |
| V | Average absorption of the sphere inner surface when there is a sample in the sample port |
| V0 | Average absorption of the sphere inner surface when there is no sample in the sample port |
| VSPC | Average absorption of the sphere inner surface when there is a Spectralon in the sample port |
| ρ | Sphere constant when there is a sample in the sample port |
| ρ0 | Sphere constant when there is no sample in the sample port |
| acd | Attenuation factor for collimated radiation that is diffusely scattered by the sample |
| ad | Attenuation factor for diffuse radiation that is diffusely scattered by the sample |
| a0 | Attenuation factor for diffuse radiation traveling through an empty sample port |
| Gc | Gap fraction for the collimated light beam incident upon the sample |
| Gd | Gap fraction for the diffuse radiation field incident upon the sample |
| R | Diffuse reflectance of the sample material |
| T | Diffuse transmittance of the sample material |
| Rb | Reflectance of black background |
| DIS | Double integrating sphere (OceanOptics SpectroClip-TR) |
| SIS | Single integrating sphere (ASD RTS-3ZC) |
| SISref | Reference single integrating sphere |
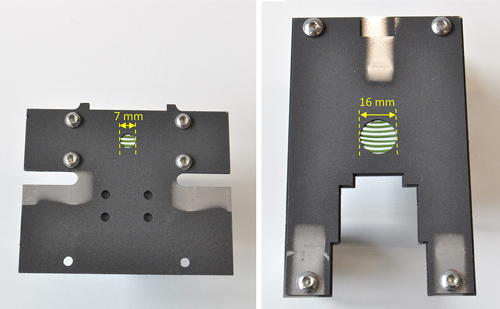
Fig. 1. Photographs of needle carriers with Norway spruce needles attached in the carrier opening. The carrier on the left was designed for Ocean Optics SpectroClip-TR double integrating sphere, and the carrier on the right was designed for ASD RTS-3ZC single integrating sphere. Diameters of the sample ports in these two measurements setups were 6 mm and 15 mm, respectively. See Section 2.2 and Supplementary file S1 for detailed description of these two measurement setups.
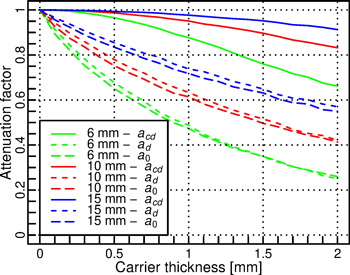
Fig. 2. Simulated attenuation factors for different sphere port diameters (6, 10, and 15 mm) and carrier thicknesses. The attenuation factors are defined separately for collimated radiation that is diffusely scattered by the sample (acd), for diffuse radiation that is diffusely scattered by the sample (ad), and for diffuse radiation traveling through an empty sample port (a0).
| Table 2. Overview of samples measured in the experiment. For each sample two measurements were made: one for each side of sample. See Suppl. file S1 for the list of spectrometer readings recorded for each sample. | |||
| Double integrating sphere (DIS) | Single integrating sphere (SIS) | Reference method (SISref) | |
| Paper, leaf-like, without carriers a | 4 | 4 | 2 |
| Silicon, leaf-like, without carriers a | 4 | 4 | 2 |
| Paper, leaf-like, with carriers a | 4 | 4 | - |
| Silicon, leaf-like, with carriers a | 4 | 4 | - |
| Paper, needle-like | 6 | 6 | - |
| Norway spruce needles | 6 | 6 | - |
| a The same four samples were measured with all methods to minimize the effect of random variations. The reference method is an exception: a subset of two samples was measured with it due to time consumption. | |||
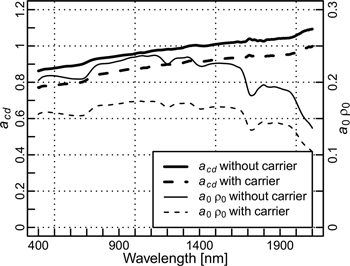
Fig. 3. Estimates of attenuation factor acd and sphere constant a0ρ0 in the double integrating sphere, with and without needle carriers.
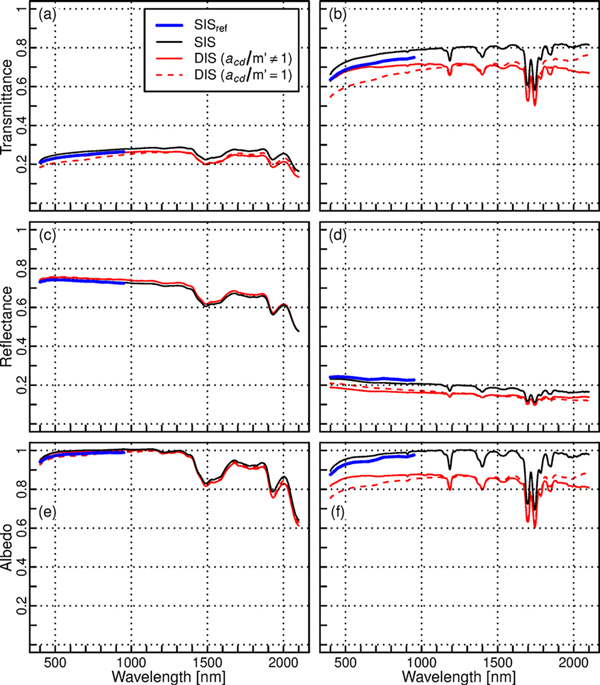
Fig. 4. Mean transmittance (a, b), reflectance (c, d), and albedo (e, f) spectra of leaf-like samples of paper (left column: a, c, e) and silicon (right column: b, d, f) measured with different methods (SISref = reference method, SIS = single integrating sphere, DIS = double integrating sphere). No needle carriers were used in these measurements.
| Table 3. Relative mean differences [%] of double (DIS) and single (SIS) integrating spheres against the reference method (SISref) for leaf-like paper and silicon samples measured without needle carriers. The values are given separately for all wavelengths (400–950 nm), and visible (400–700 nm) and near-infrared (700–950 nm) regions. | ||||||
| All (400–950 nm) | Visible (400–700 nm) | Near-infrared (700–950 nm) | ||||
| Paper | Silicon | Paper | Silicon | Paper | Silicon | |
| Transmittance | ||||||
| DIS, acd/m’=1 | –9 | –12 | –11 | –13 | –8 | –10 |
| DIS, acd/m’≠1 | –1 | –3 | 0 | –2 | –2 | –4 |
| SIS | 6 | 5 | 6 | 6 | 6 | 5 |
| Reflectance | ||||||
| DIS, acd/m’=1 | 2 | –19 | 2 | –17 | 2 | –22 |
| DIS, acd/m’≠1 | 2 | –26 | 2 | –25 | 2 | –28 |
| SIS | 0 | –7 | 0 | –6 | 0 | –9 |
| Albedo | ||||||
| DIS, acd/m’=1 | –1 | –13 | –1 | –14 | 0 | –13 |
| DIS, acd/m’≠1 | 1 | –9 | 1 | –8 | 1 | –10 |
| SIS | 2 | 2 | 1 | 3 | 2 | 2 |
| Table 4. Relative mean difference [%] of double integrating sphere (DIS) against single integrating sphere (SIS) for different targets and measurement configurations. The values are given separately for all wavelengths (400–2100 nm), and visible (400–700 nm) near-infrared (700–1300 nm) and shortwave-infrared (1300–2100 nm) regions. | ||||||||||||
| All (400–2100 nm) | Visible (400–700 nm) | Near-infrared (700–1300 nm) | Shortwave-infrared (1300–2100 nm) | |||||||||
| Paper | Silicon | Spruce needles | Paper | Silicon | Spruce needles | Paper | Silicon | Spruce needles | Paper | Silicon | Spruce needles | |
| Transmittance | ||||||||||||
| Leaflike, without carrier | –9 | –11 | - | –6 | –7 | - | –7 | –10 | - | –12 | –14 | - |
| Leaflike, with carrier | –10 | –9 | - | –9 | –4 | - | –7 | –8 | - | –12 | –11 | - |
| Needlelike, with carrier | –11 | - | –62 | –9 | - | –107 | –7 | - | –31 | –15 | - | –67 |
| Reflectance | ||||||||||||
| Leaflike, without carrier | 2 | –19 | - | 2 | –21 | - | 2 | –21 | - | 2 | –18 | - |
| Leaflike, with carrier | 1 | –17 | - | 1 | –17 | - | 1 | –19 | - | 1 | –15 | - |
| Needlelike, with carrier | –4 | - | –17 | –4 | - | –24 | –5 | - | –11 | –4 | - | –19 |
| Albedo | ||||||||||||
| Leaflike, without carrier | –1 | –13 | - | 0 | –10 | - | 0 | –12 | - | –2 | –14 | - |
| Leaflike, with carrier | –2 | –10 | - | –1 | –7 | - | –1 | –10 | - | –3 | –12 | - |
| Needlelike, with carrier | –6 | - | –31 | –5 | - | –35 | –5 | - | –19 | –7 | - | –39 |
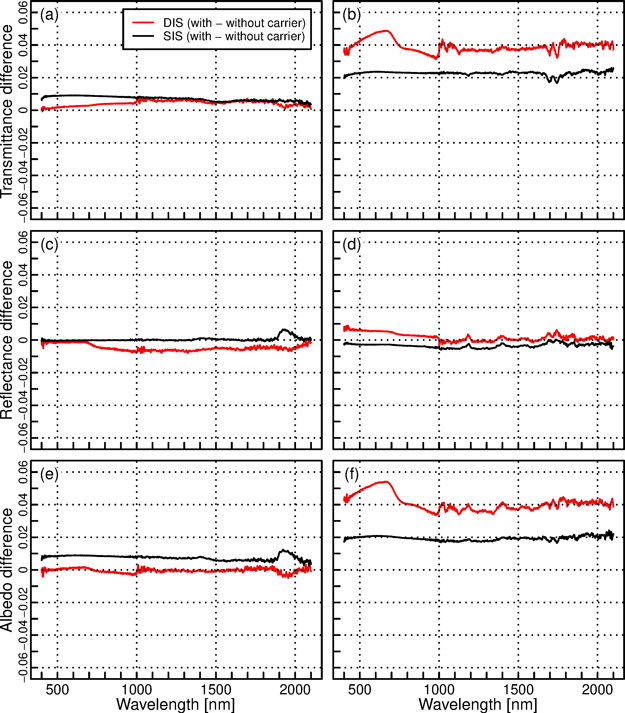
Fig. 5. Mean differences in transmittance (a, b), reflectance (c, d), and albedo (e, f) spectra when the measurements were performed with and without needle carriers. The materials measured were paper (left column: a, c, e), and silicon (right column: b, d, f). The color of lines represents different methods (SIS = single integrating sphere, DIS = double integrating sphere).
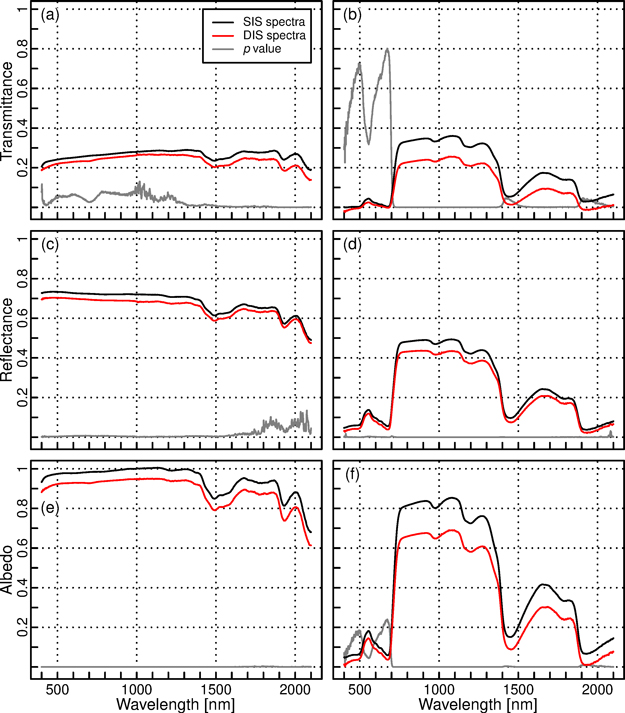
Fig. 6. Mean transmittance (a, b), reflectance (c, d), and albedo (e, f) spectra of needle-like samples of paper (left column: a, c, e) and spruce needles (right column: b, d, f) measured with single (SIS) and double (DIS) integrating spheres. The gray line indicates p value of Welch’s t-test (the scale is the same as for the spectral quantities, i.e. from 0 to 1).
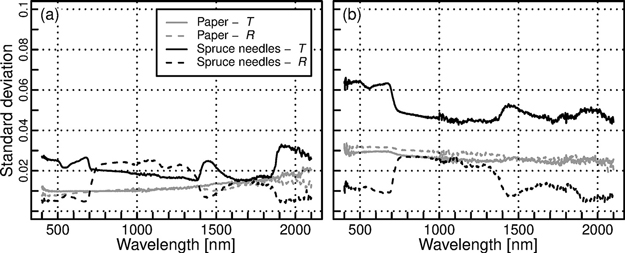
Fig. 7. Standard deviation of reflectance (R) and transmittance (T) spectra of paper and spruce needles measured with (a) single integrating sphere (SIS) and (b) double integrating sphere (DIS).