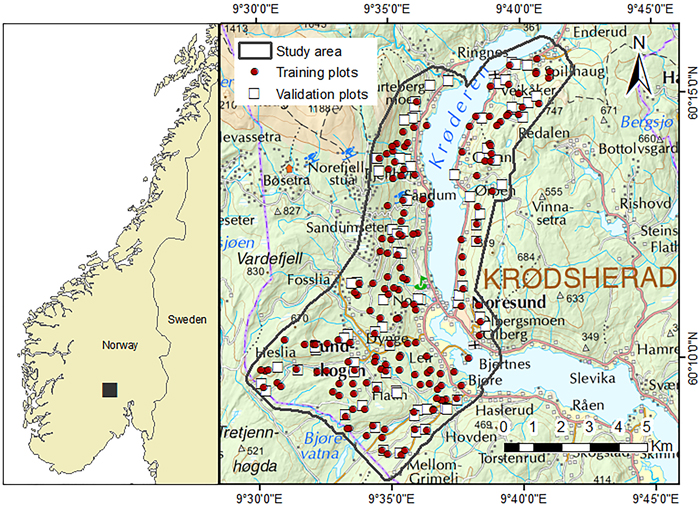
Fig. 1. Map of the location of the study area and field plot positions.
| Table 1. Summary of the ground reference biophysical forest attributes by stratum (after season correction). |
| Young forest | Mature forest SI ≤ 11 m | Mature forest SI > 11 m |
| Range | mean | Range | mean | Range | mean |
| Training plots | 2001 | n | 35 | | 37 | | 37 | |
| Ho | 10.3–25.1 | 17.6 | 10.7–25.5 | 17.5 | 18.8–28.9 | 23.4 |
| HL | 8.2–20.5 | 13.8 | 9.9–23.5 | 15.7 | 15.8–26.8 | 20.6 |
| N | 386–3693 | 1809 | 172–1632 | 629 | 301–1503 | 819 |
| G | 6.4–62.6 | 25.1 | 5.3–43.1 | 22.7 | 15.5–56.9 | 34.2 |
| V | 29.8–642.9 | 187.8 | 28.7–420.3 | 178.9 | 121.2–681.6 | 337.5 |
| AGB | 19.1–368.6 | 117.2 | 17.7–241.6 | 102.9 | 76.6–355.0 | 192.9 |
| 2016 | n | 40 | | 34 | | 42 | |
| Ho | 11.9–28.8 | 18.2 | 11.5–25.7 | 18.2 | 17.5–30.3 | 22.9 |
| HL | 9.0–25.2 | 14.9 | 11.0–24.3 | 16.6 | 14.8–25.9 | 19.8 |
| N | 429–3220 | 1545 | 129–1331 | 609 | 301–3521 | 958 |
| G | 6.2–72.6 | 27.9 | 5.3–58.4 | 26.6 | 14.2–72.2 | 34.6 |
| V | 26.4–904.3 | 214.6 | 30.3–532.6 | 220.9 | 100.9–819.2 | 328.6 |
| AGB | 20.3–499.7 | 136.5 | 19.0–286.2 | 127.1 | 73.6–404.1 | 185.3 |
| Forecasted 2016 | n | 12 | | 33 | | 42 | |
| Ho | 14.0–27.2 | 18.9 | 11.8–26. 5 | 18.5 | 15.9–30 .0 | 22.1 |
| HL | 11.6–22.9 | 15.7 | 11.0–24.4 | 16.9 | 13.0–28.0 | 19.2 |
| N | 429–2319 | 1417 | 172–1202 | 599 | 301–3306 | 1114 |
| G | 15.8–86.8 | 34.8 | 7.4–60.1 | 28.4 | 12.7–73.3 | 38.9 |
| V | 97.7–975.2 | 292.2 | 41.9–582.5 | 237.0 | 104.1–903.3 | 357.6 |
| AGB | 62.0–552.3 | 178.4 | 26.1–311.8 | 135.6 | 73.5–439.8 | 204.0 |
| Validation plots | 2016 | n | 11 | | 14 | | 24 | |
| Ho | 16.1–20.7 | 18.3 | 13.7–24.6 | 17.9 | 17.6–26.4 | 23.1 |
| HL | 13.5–17.2 | 15.4 | 12.1–20.9 | 15.9 | 14.9–25.1 | 20.4 |
| N | 452–1712 | 1254 | 201–1147 | 632 | 337–1221 | 762 |
| G | 13.9–30.7 | 25.7 | 10.4–40.8 | 22.9 | 17.9–46.5 | 30.6 |
| V | 99.1–241.6 | 194.1 | 68.8–359.8 | 178.6 | 124.5–525.2 | 298.7 |
| AGB | 64.6–163.0 | 125.7 | 41.2–221.1 | 108.6 | 87.2–294.8 | 170.0 |
| Table 2. Airborne laser scanning acquisition parameters. |
| Year of acquisition | 2001 (T1) | 2016 (T2) |
| Time period | 23 June – 1 August | 7 June – 31 July |
| Aircraft | Piper PA-31 | Piper PA-31 |
| Laser scanning system | Optech ALTM 1210 | Riegl LMS Q-1560 |
| Operating firm | Fotonor AS | Terratec AS |
| Average flying altitude (m) | 650 | 1280 |
| Average flying speed (m s–1) | 75 | 69 |
| Pulse repetition frequency PRF (kHz) | 10 | 534 |
| Scanning frequency (kHz) | 30 | 115 |
| Side overlap (%) | 50 | 20 |
| Maximum scan angle (degrees) | 15 | 20 |
| Average point density (pts m–2) | 0.9 | 11.8 |
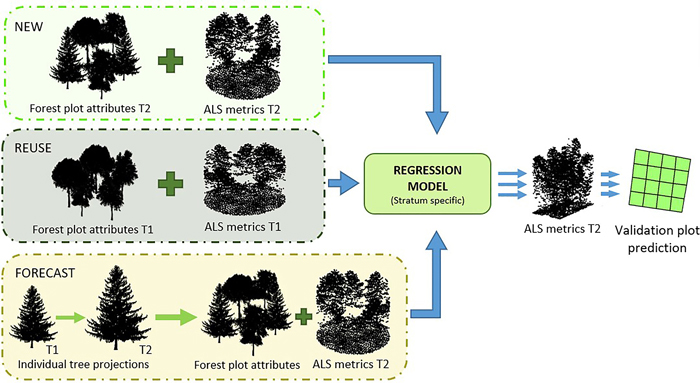
Fig. 2. Conceptual framework of the three approaches. Top: The NEW approach represents concurrent ALS and field reference values from T2 used to construct models that later were used to make predictions on the validation plots. Middle: The REUSE approach applies temporally transferred models from T1 to predict the forest attributes at T2. Bottom: The FORECAST approach applies data projected from T1 to T2 together with ALS data from T2 used to construct models that were used for predictions on the validation plots.
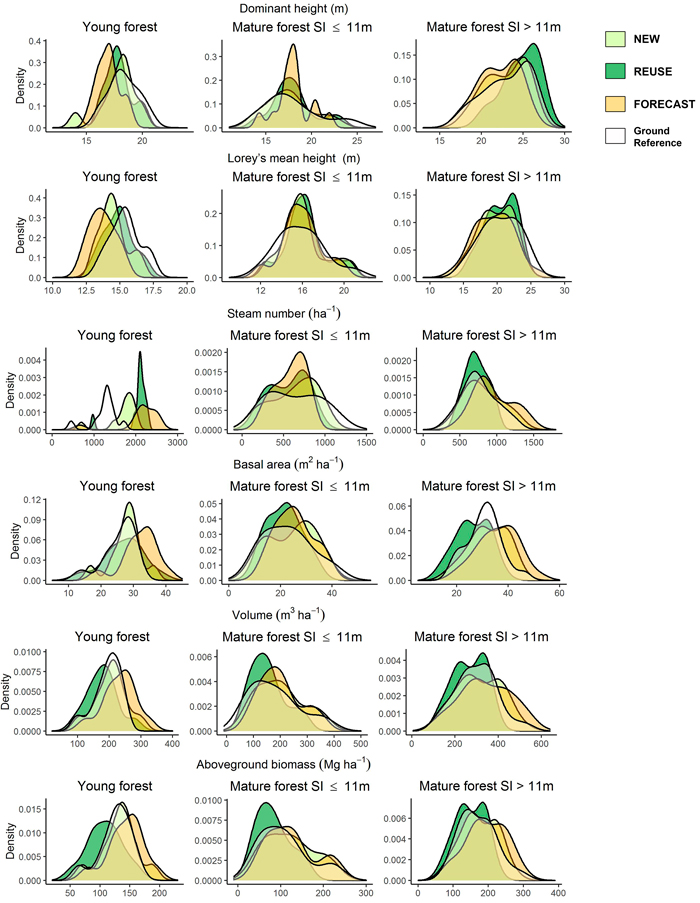
Fig. 3. Density plots showing the distributions of the ground references and the estimated biophysical forest attributes for the different approaches.
| Table 3. Selected variables for the predictive nonlinear models of biophysical forest attributes (BFA) by approach and their respective model fit and error structure. View in new window/tab. |
| Table 4. Validation accuracy assessment of the biophysical forest attributes (BFA) estimates. View in new window/tab. |