| Table 1. Characteristics of five Scots pine (Pinus sylvestris) progeny field trials, established in different regions of Lithuanian provenance in 1983. | ||||||
| Trial code * | Forest enterprise | Forest district | Area (ha) | Planting design (m) | Soil ** | Coordinates |
| 28PBZ008 | Veisiejai | Latežeris | 2.0 | 1.5 × 1.5 | Na | 53°58´N, 24°09´E |
| 03PBZ010 | Veisiejai | Kapčiamiestis | 2.5 | 1.5 × 1.5 | Nb | 53°58´N, 23°43´E |
| 06PBZ005 | Ignalina | Vaišniūnai | 1.5 | 1.5 × 1.5 | Na | 55°24´N, 26°09´E |
| 31PBZ007 | Nemenčinė | Purviniškės | 1.5 | 1.5 × 1.5 | Nc | 55°01´N, 25°38´E |
| 22PBZ009 | Šilutė | Žemaitkiemis | 1.5 | 2.0 × 1.0 | Nd | 55°14´N, 21°31´E |
| * The code in the Lithuanian Forest Seed Database. ** Na – very oligotrophic mineral soils of normal moisture; Nb – oligotrophic mineral soils of normal moisture; Nc – mesotrophic mineral soils of normal moisture; Nd – eutrophic mineral soils of normal moisture (Vaičys 2001). | ||||||
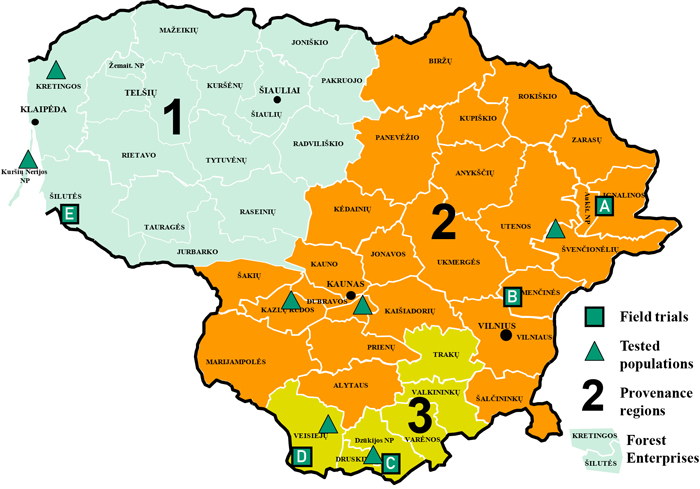
Fig. 1. Scots pine progeny field trials, provenance regions, and population origins. Scots pine progeny field trials used in the study: A – Ignalina, B – Nemenčinė, C – Druskininkai, D – Veisiejai, E – Šilutė. View larger in new window/tab.
| Table 2. Percentage of living scots pine trees in 2012 and 2018 years from the initial planted number of trees; the change of percentage points (∆) of living trees between the period of two assessments; the area of damaged plots in 2018 (expressed as percentage from total field trial area); and the average damaged plot size by Heterobasidion annosum in 2012 and 2018 (m2). | |||||||
| Code | Field trials | Percentage (%) | The change of percentage points (∆) | The area of damage plots in 2018 (%) | The average of damage plot in 2012 and 2018 (m2) | ||
| 2012 | 2018 | 2012 | 2018 | ||||
| A | Ignalina | 49 | 43 | –6 | 21.1 | 94 | 264 |
| B | Nemenčinė | 39 | 27 | –12 | 16.9 | 131 | 254 |
| C | Druskininkai | 56 | 52 | –4 | 16.9 | 92 | 282 |
| D | Veisiejai | 52 | 45 | –7 | 16.8 | 199 | 351 |
| E | Šilutė | 52 | 32 | –20 | 27.1 | 180 | 239 |
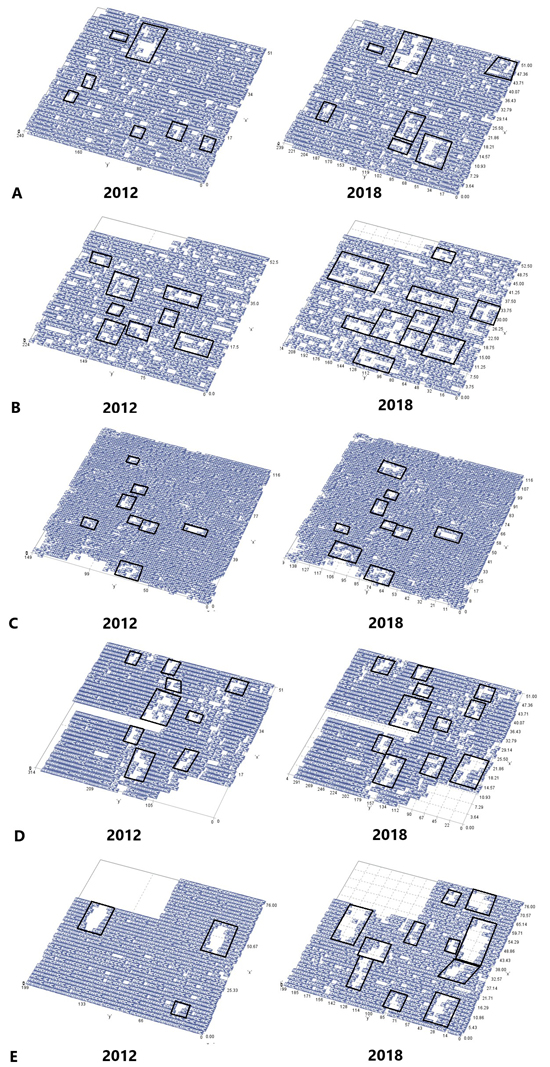
Fig. 2. Damaged areas in Scots pine progeny field trials during the 2012 and 2018 assessments. X – distance between the rows, Y – distance inside the rows. Scots pine progeny field trials used in the study: A – Ignalina, B – Nemenčinė, C – Druskininkai, D – Veisiejai trial, E – Šilutė. Damaged areas are contoured in black.
| Table 3. Variance components and family heritability estimates of resistance to Heterobasidion annosum index in Lithuanian Scots pine progeny field trials (damaged plots in 2012). Variance components and standard errors given in percentage (* – 95%, ** – 99%, *** – 99.9%) | ||||||||
| Field trials | Family component (%) | ±SE | p-value | h2f | Population | Replicate | ||
| F criterion | p-value | F criterion | p-value | |||||
| Druskininkai | 54.4 | 10.5 | *** | 0.75 | 1.41 | . | 66.32 | *** |
| Ignalina | 18.6 | 4.4 | *** | 0.56 | 2.44 | * | 10.76 | *** |
| Nemenčinė | 23.2 | 5.0 | *** | 0.65 | 3.45 | ** | 1.71 | . |
| Šilutė | 50.7 | 10.2 | *** | 0.81 | 2.01 | . | 8.04 | *** |
| Veisiejai | 38.6 | 7.0 | *** | 0.77 | 0.93 | . | 4.91 | *** |
| Designation: h2f – family heritability. | ||||||||
| Table 4. Variance components and family heritability estimates of resistance to Heterobasidion annosum index in Lithuanian Scots pine progeny field trials (damaged plots in 2018). Variance components and standard errors given in percentage (* – 95%, ** – 99%, *** – 99.9%) | ||||||||
| Field trials | Family component (%) | ±SE | p-value | h2f | Population | Replicate | ||
| F criterion | p-value | F criterion | p-value | |||||
| Druskininkai | 53.4 | 11.0 | *** | 0.81 | 1.07 | . | 115.52 | *** |
| Ignalina | 62.0 | 11.3 | *** | 0.89 | 0.49 | . | 12.18 | *** |
| Nemenčinė | 48.5 | 8.6 | *** | 0.85 | 2.65 | * | 27.80 | *** |
| Šilutė | 26.1 | 4.7 | *** | 0.74 | 2.64 | * | 21.83 | *** |
| Veisiejai | 51.7 | 9.2 | *** | 0.82 | 1.56 | . | 10.50 | *** |
| Designation: h2f – family heritability. | ||||||||
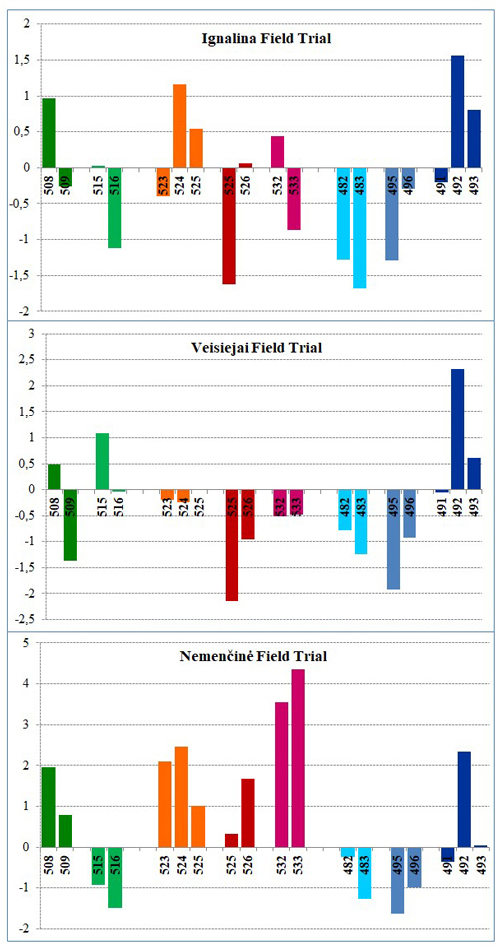
Fig. 3. Estimate of resistance to Heterobasidion annosum of selected Scots pine half-sib families (with the same colouring) that occurred together in at least one designated root rot-damaged plot in each of the three selected field trials. Numbers represent the different Scots pine half-sib families.
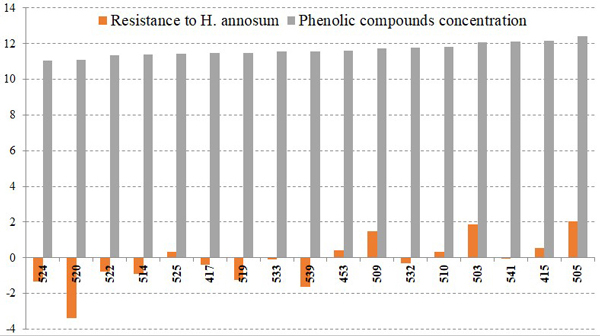
Fig. 4. Total phenolic compound concentration and resistance to Heterobasidion annosum estimates of 17 Scots pine half-sib families in the Ignalina field trial.