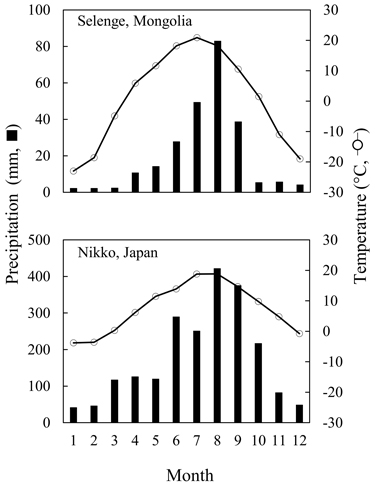
Fig. 1. Monthly mean precipitation and temperature of sampling sites in the present study.
Note: Mongolian and Japanese climate data were provided from the Information and Research Institute of Meteorology, Hydrology, and Environment, Mongolia, and Japan Meteorological Agency, respectively. Mean monthly precipitation and temperature were calculated by averaging monthly values obtained from the data for the last 5 years (2014–2018). Bars indicate mean value of precipitation, and circles and solid lines indicate mean values of temperature of average values for 5 years in each month.
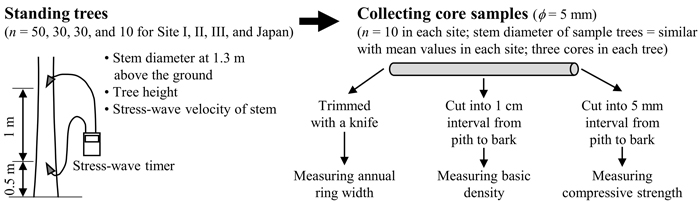
Fig. 2. Illustration of the experimental procedures in standing trees measurements of Betula platyphylla and core sample preparation for testing.
Note: φ, diameter of core samples.
| Table 1. Growth characteristics and stress-wave velocity in wood of Betula platyphylla naturally grown in Mongolia and Japan. | |||||||||||||
| Site | n | D (cm) | TH (m) | SWV (km s–1) | |||||||||
| Mean | SD | Min. | Max. | Mean | SD | Min. | Max. | Mean | SD | Min. | Max. | ||
| I | 50 | 13.4 | 2.8 | 9.0 | 21.0 | 11.0 | 2.0 | 7.7 | 14.8 | 3.29 | 0.20 | 2.87 | 3.65 |
| II | 30 | 22.7 | 5.1 | 15.4 | 36.7 | 17.6 | 3.3 | 10.3 | 25.8 | 3.76 | 0.48 | 2.62 | 4.44 |
| III | 30 | 19.4 | 3.2 | 13.8 | 26.9 | 15.9 | 2.0 | 10.5 | 18.7 | 3.61 | 0.33 | 2.76 | 4.14 |
| Mean/total | 110 | 17.6 | 5.4 | 9.0 | 36.7 | 14.1 | 3.8 | 7.7 | 25.8 | 3.50 | 0.39 | 2.62 | 4.44 |
| Nikko, Japan | 10 | 17.8 | 2.7 | 13.8 | 21.8 | 17.1 | 2.3 | 14.4 | 21.2 | 4.07 | 0.13 | 3.87 | 4.26 |
| Significance | ns | * | ** | ||||||||||
| n, number of standing trees; D, stem diameter at 1.3 m above the ground; TH, tree height; SWV, stress-wave velocity of stems; SD, standard deviation; Min., minimum; Max., maximum. Significant differences were obtained by t-test between Mongolian trees (110 trees) and Japanese trees (10 trees). **, significant difference (p < 0.01); *, significant difference (p < 0.05); ns, no significant difference. | |||||||||||||
| Table 2. Number of annual rings and annual ring width in the sample of 30 Mongolian and 10 Japanese Betula platyphylla trees. | |||||||||
| Site | n | Number of annual rings | Annual ring width (mm) | ||||||
| Mean | Min. | Max. | Mean | SD | Min. | Max. | |||
| I | 10 | 42 | 36 | 54 | 1.42 | 0.21 | 0.23 | 4.28 | |
| II | 10 | 83 | 74 | 93 | 1.13 | 0.15 | 0.13 | 3.45 | |
| III | 10 | 67 | 62 | 76 | 1.27 | 0.09 | 0.09 | 3.48 | |
| Mean/total | - | - | - | - | 1.27 | 0.15 | 0.15 | 3.74 | |
| Nikko, Japan | 10 | 54 | 49 | 60 | 1.46 | 0.21 | 0.44 | 3.92 | |
| Significance | - | ns | |||||||
| n, number of sample trees; SD, standard deviation; Min., minimum; Max., maximum. Significant differences were obtained by t-test between Mongolian and Japanese samples. ns, no significant difference. | |||||||||
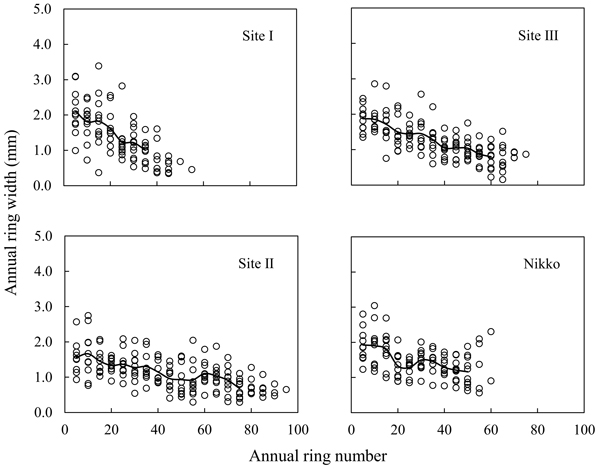
Fig. 3. Radial variations in annual ring width in Mongolian and Japanese Betula platyphylla trees.
Note: Solid lines indicate mean values of 10 trees at each site.
| Table 3. Means and standard deviations of wood properties in the sample of 30 Mongolian and 10 Japanese Betula platyphylla trees. | ||||||||||
| Site | n | BD (g cm–3) | CS (MPa) | |||||||
| Mean | SD | Min. | Max. | Mean | SD | Min. | Max. | |||
| I | 10 | 0.49 | 0.04 | 0.41 | 0.53 | 20.5 | 2.2 | 16.8 | 23.6 | |
| II | 10 | 0.55 | 0.02 | 0.51 | 0.58 | 21.3 | 1.1 | 19.4 | 23.9 | |
| III | 10 | 0.51 | 0.02 | 0.47 | 0.53 | 19.2 | 1.8 | 16.1 | 21.9 | |
| Mean/total | 30 | 0.51 | 0.04 | 0.41 | 0.58 | 20.4 | 1.9 | 16.1 | 23.9 | |
| Nikko, Japan | 10 | 0.49 | 0.02 | 0.45 | 0.52 | 21.3 | 1.5 | 18.8 | 23.6 | |
| Significance | ** | ns | ||||||||
| n, number of sample trees; BD, basic density; CS, compression strength; SD, standard deviation; Min., minimum; Max., maximum. Significant differences were obtained by t-test between Mongolian and Japanese samples. **, significant difference (p < 0.01); ns, no significant difference. | ||||||||||
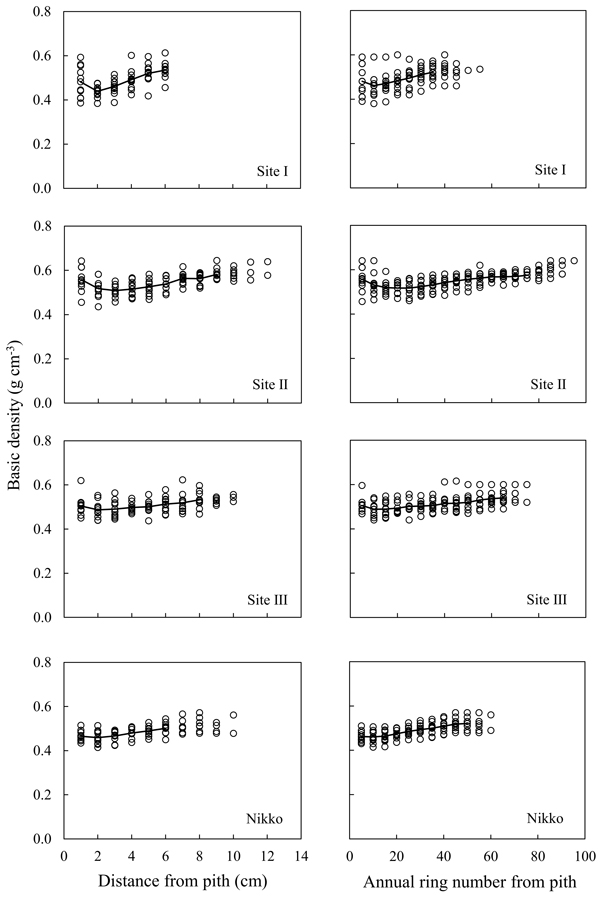
Fig. 4. Radial variations in basic density in Mongolian and Japanese Betula platyphylla trees.
Note: Solid lines indicate mean values of 10 trees at each site.
| Table 4. Mean values of basic density in certain radial positions in the sample trees of 30 Mongolian Betula platyphylla trees. | |||||||||
| Radial position (annual ring number) | Site I (n = 10) | Site II (n = 10) | Site III (n = 10) | Significance among three sites | |||||
| Mean | SD | Mean | SD | Mean | SD | ||||
| 1–5 | 0.48 | 0.07 | 0.56 | 0.05 | 0.51 | 0.04 | ** | ||
| 6–10 | 0.46 | 0.06 | 0.53 | 0.05 | 0.49 | 0.03 | ** | ||
| 11–15 | 0.47 | 0.05 | 0.52 | 0.03 | 0.49 | 0.04 | * | ||
| 16–20 | 0.48 | 0.05 | 0.52 | 0.03 | 0.49 | 0.03 | ns | ||
| 21–25 | 0.50 | 0.05 | 0.52 | 0.04 | 0.50 | 0.03 | ns | ||
| 26–30 | 0.51 | 0.04 | 0.52 | 0.03 | 0.50 | 0.03 | ns | ||
| 31–35 | 0.52 | 0.03 | 0.53 | 0.03 | 0.51 | 0.03 | ns | ||
| n, number of sample trees; SD, standard deviation; F- and p-values obtained by analysis of variance (ANOVA) test among three sites. **, significant difference (p < 0.01); *, significant difference (p < 0.05); ns, no significant difference. | |||||||||
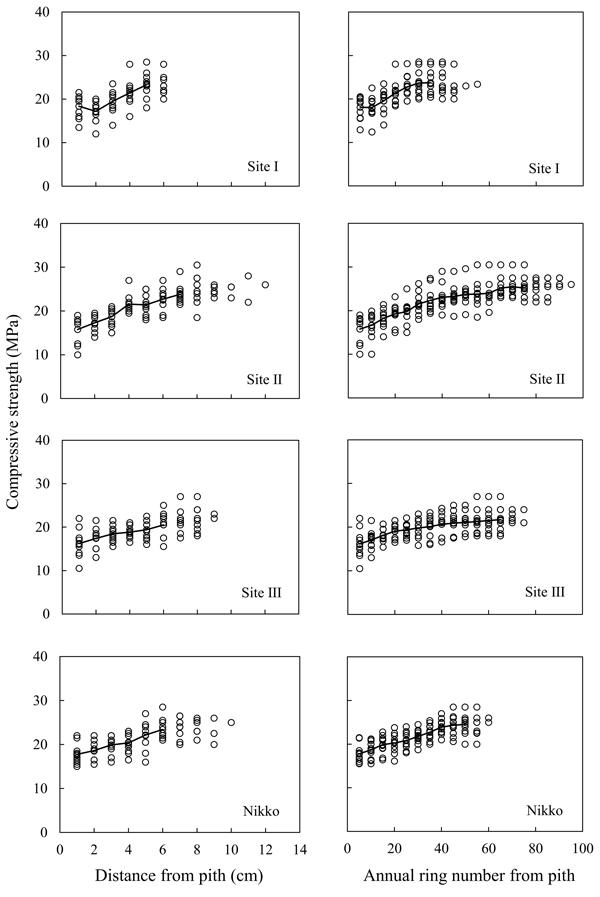
Fig. 5. Radial variations in compressive strength parallel to the grain at green condition in Mongolian and Japanese Betula platyphylla trees.
Note: Solid lines indicate mean values of 10 trees at each site.
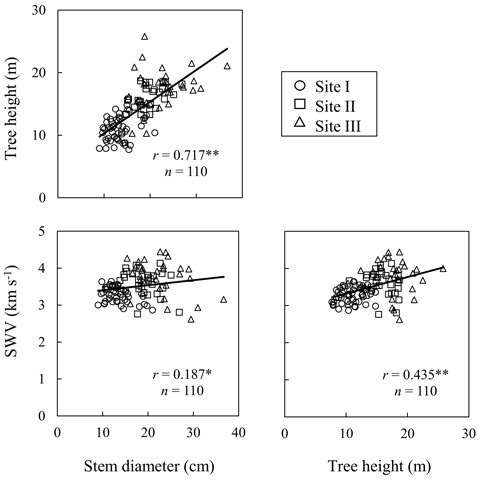
Fig. 6. Relationships between stem diameter or tree height and stress-wave velocity (SWV) of stems in 110 Mongolian Betula platyphylla trees.
Note: Circles, triangles, and squares indicate Site I, Site II, and Site III, respectively. n, number of sample trees; r, correlation coefficient; **, significant correlation (p < 0.01); *, significant correlation (p < 0.05).
| Table 5. Correlation coefficients among measured characteristics in the sample of 30 Mongolian Betula platyphylla trees. | ||||||
| Property | D | TH | ARW | SWV | BD | CS |
| D | ** | * | * | ** | ns | |
| TH | 0.696 | ** | ** | ** | ns | |
| ARW | –0.450 | –0.587 | ** | * | ns | |
| SWV | 0.446 | 0.532 | –0.478 | ** | ns | |
| BD | 0.565 | 0.574 | –0.384 | 0.552 | ** | |
| CS | 0.101 | 0.151 | –0.144 | 0.221 | 0.499 | |
| D, stem diameter at 1.3 m above the ground; TH, tree height; ARW, annual ring width; SWV, stress-wave velocity of stems; BD, basic density; CS, compressive strength; **, significant correlation (p < 0.01); *, significant correlation (p < 0.05); ns, no significant. | ||||||
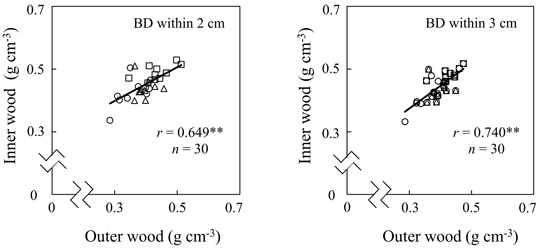
Fig. 7. Relationships of basic density (BD) between inner and outer wood in the sample of Mongolian Betula platyphylla trees.
Note: Circles, triangles, and squares indicate Site I, Site II, and Site III, respectively. n, number of sample trees; r, correlation coefficient; **, significant correlation (p < 0.01).