| Table 1. Existing publications on single tree volume and stem shape models for teak. | |||
| Source | Region | Model Application | Modelling Dataset |
| Pérez and Kanninen (2003) | Costa Rica | Total and merchantable stem volume | 111 trees Age 2–47 years Diameter 2–59 cm |
| Malimbwi et al. (2005) | Tanzania | Total stem volume | - |
| van Zyl (2005) | Tanzania | Stem volume, height and form | 222 trees Diameter 8–79 cm Height 9–34 m |
| Figueiredo et al. (2006) | Brazil | Stem volume and profile | 159 trees Age 7–10 years |
| Pérez (2008) | Costa Rica | Total and merchantable stem volume | 25 trees Age 8–46 Diameter 9–55 cm |
| Reggiani (2009) | Brazil | Total stem volume | - |
| Figueiredo et al. (2014) | Brazil | Stem volume and height (a book with some 40 equations for teak volume and height) | - |
| Ribeiro (2014) | Brazil | Stem heartwood volume | 40 trees Diameter 10–35 cm Height 14–27 m |
| Fallas (2017) | Costa Rica | Total and merchantable stem volume of clonal teak trees | 306 trees Age 3–12 years Diameter 9–32 cm |
| Table 2. Existing publications on stand-level growth and yield models for teak. | ||||
| Source | Region | Model Application | Modelling Dataset | Comments |
| Nunifu (1997) | Ghana | Stand-level yield models for dominant height, diameter, basal area, volume and biomass. Weibull model for diameter distribution modelling. | 100 sample plots Age 3–40 years | Modelling data includes only low yield sites |
| Bermejo (2004) | Costa Rica | Yield models/tables based on dominant height development | 318 sample plots | Modelling data covers only first half of full rotation. |
| Drescher (2004) | Brazil | Stand-level yield models for mean diameter, dominant height, form factor, stocking, basal area and volume | 162 sample plots Age 2–10 years Diameter 8–21 cm Height 10–18 m | Modelling data covers only first half of full rotation. |
| Pérez and Kanninen (2005) | Costa Rica | Stand-level growth curves for mean diameter and dominant height as a function of age | 150 sample plots Age 1–47 years | |
| García el al. (2006) | Brazil | Diameter distribution models for early thinning simulations | 239 sample plots Age < 96 months | |
| Saraiva et al. (2006) | Brazil | Diameter distribution models for early thinning simulations | 239 sample plots Age < 96 months | Same data as in García et al. (2006) |
| Batista (2007) | Brazil | Dominant height model for young teak plantations | Age < 12 years | |
| Pérez (2008) | Costa Rica | Stand-level dominant height curve | 25 sample trees | |
| Tewari et al. (2014) | India | Stand-level growth curves for dominant height, mortality, basal area and volume | 22 sample plots with 3 consecutive measurements Age 11–38 years | |
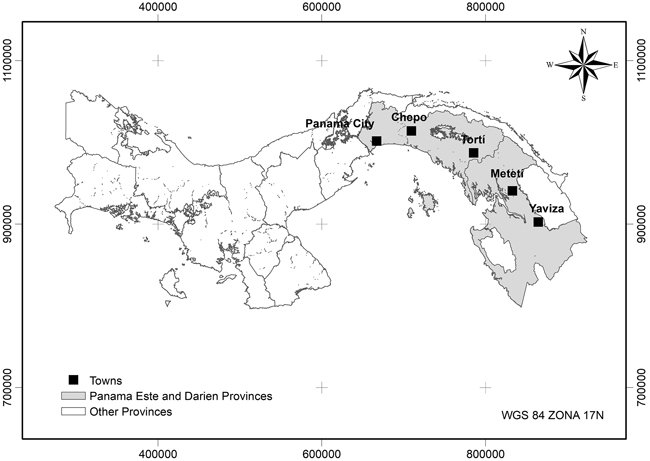
Fig. 1. Location of the teak growth and yield study area in Panama (Panama Este and Darien Provinces).
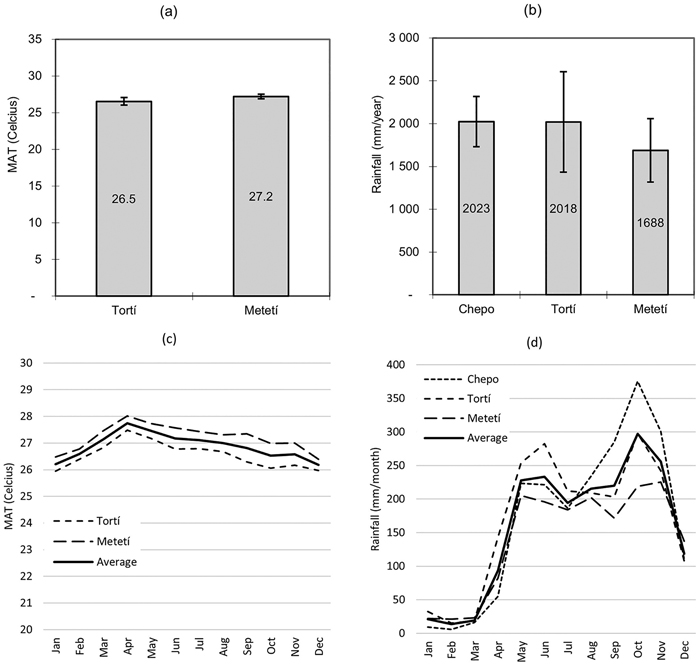
Fig. 2. Climate in different locations in the study area. Mean annual temperature and its standard deviation (graph a); total annual rainfall and its standard deviation (graph b); monthly average temperature (graph c); monthly average rainfall (graph d).
| Table 3. Soil characteristics in teak plantations in the study area and teak optimum requirements for soil parameters as reported in published literature. | |||||||
| Soil Parameter | Unit | Method | N | Mean | St. Dev. | Teak Optimum | Source |
| Sand | % | Bouyoucos | 305 | 20% | 11% | 55…65% | (1) |
| Loam | % | Bouyoucos | 305 | 15% | 6% | … | … |
| Clay | % | Bouyoucos | 305 | 65% | 13% | 35...45% | (1) |
| Organic matter | % | Walkey-Black | 305 | 1.0% | 0.7% | 2.5…4.0+% | (1) |
| pH | NA | Water 1:2.5 | 305 | 6.1 | 0.6 | 5.5…6.2…7.2 | (1) |
| P | mg l–1 | Mehlich-1 | 305 | 10.2 | 20.1 | 3…10 | (1) (4) |
| K | mg l–1 | Mehlich-1 | 305 | 157 | 98 | >40…120+ | (1) |
| Ca | meq 100 g–1 | KCL | 305 | 23.1 | 13.2 | 1.5…4.0+ | (1) |
| Mg | meq 100 g–1 | KCL | 305 | 7.4 | 8.3 | 1.0…4.0 | (1) |
| Ca + Mg | meq 100 g–1 | KCL | 305 | 30.5 | 16.4 | 2.5…6.0+ | (1) |
| Al | meq 100 g–1 | KCL | 305 | 0.6 | 1.3 | <0.2 | (1) |
| CEC | meq 100 g–1 | Cation calculation | 305 | 31.7 | 16.2 | 4…10+ | (1) |
| Acid saturation | % | (Al + H)/CEC | 305 | 4% | 10% | <3…8% | (2) (3) (4) |
| Base saturation | % | (K + Ca + Mg)/CEC | 305 | 95% | 11% | n.a. | n.a. |
| Calcium saturation | % | Ca/CEC | 305 | 69% | 11% | >40...62…75% | (2) (3) (4) (5) |
| Teak optimum values according to: (1) Jerez and Coutinho (2017) (Brazil) (2) Alvarado and Fallas (2004) (Costa Rica) (3) Vaidés (2004) (Guatemala) (4) Mollinedo et al. (2005) (Panama) (5) Fernández-Moya et al. (2015) (Central America) | |||||||
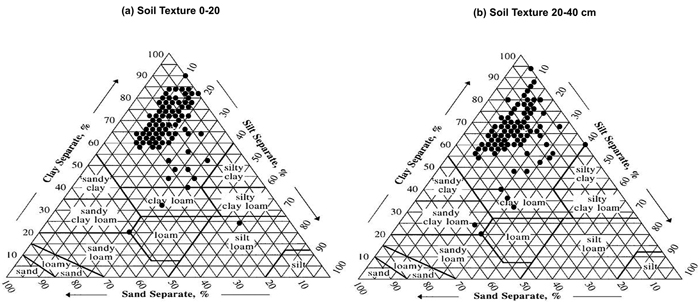
Fig. 3. Soil texture in teak plantations in the study area (n = 305). Clay, silt and sand separate were analysed on 0–20 cm and 20–40 cm sampling depths (graphs a and b respectively). View larger in new window/tab.
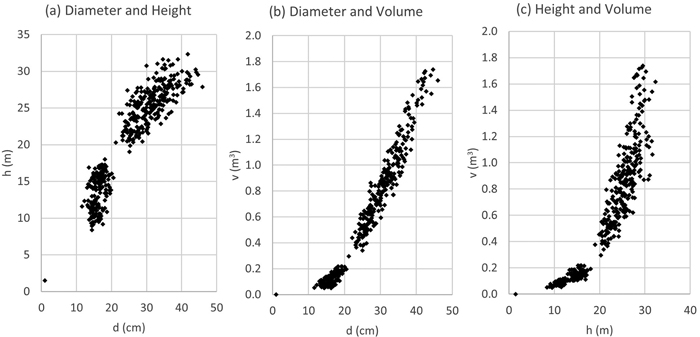
Fig. 4. Sample tree data relationships (n = 433) in stem volume and taper curve modelling dataset (d = stem diameter at 1.3 m height, h = stem height).
| Table 4. Number of sample plots in the yield model dataset. | |||
| Age | SI20 < 25.5 | SI20 > 25.5 | Total n |
| <10 | 791 | 971 | 1762 |
| >10 | 472 | 400 | 872 |
| Total n | 1263 | 1371 | 2634 |
| Table 5. Stand parameter summary in the yield model dataset. | ||||||||||
| Parameter | Age | D | Dmax | Dmin | H | Hd | N | G | V | SI20 |
| Min | 1.5 | 3.7 | 4.7 | 0.5 | 3.2 | 3.5 | 20 | 0.2 | 1.2 | 9.5 |
| Max | 19.9 | 43.3 | 54.4 | 39.0 | 29.9 | 30.3 | 1260 | 28.0 | 312.2 | 42.6 |
| Mean | 8.9 | 20.3 | 24.1 | 15.6 | 17.4 | 18.0 | 441 | 11.2 | 98.8 | 25.5 |
| Median | 7.7 | 20.4 | 24.2 | 15.9 | 17.8 | 18.3 | 360 | 11.3 | 95.9 | 25.6 |
| D = mean diameter (cm); Dmax, Dmin = maximum and minimum diameters (cm); H = mean height (m); Hd = Dominant height (m); N = stocking (trees ha–1); G = basal area (m2 ha–1); V = total stem volume (m3 ha–1); SI20 = Dominant height at base age of 20 years (m). | ||||||||||
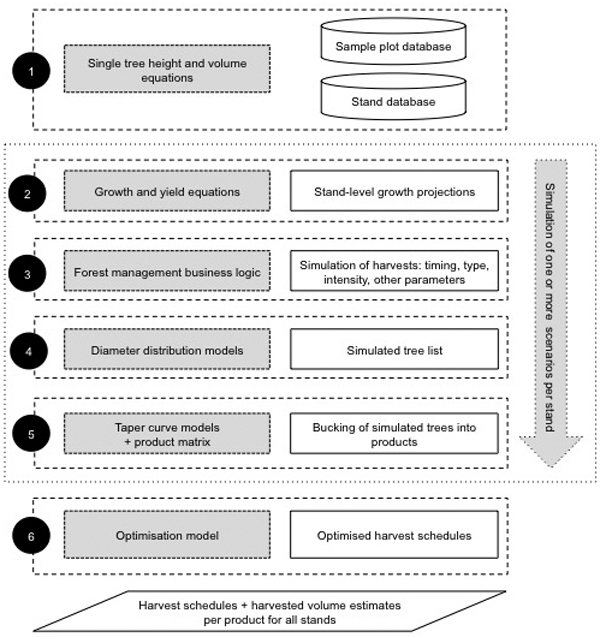
Fig. 5. Conceptual description of the forest simulator and optimisation model.
| Table 6. Selected single-entry and double-entry stem volume models. | |||||
| Model | Equation | N | R² | RMSE | Bias |
| D8 | 383 | 0.970 | 0.056 | –0.001 | |
| D10 | v = 8.2091 × exp(–70.331 / d) | 383 | 0.970 | 0.079 | +0.003 |
| DH21 | v = 0.000032589 × d2 × h | 383 | 0.974 | 0.074 | +0.011 |
| DH22 | v = 0.029387 + 0.000031543 × d2 × h | 383 | 0.973 | 0.073 | +0.000 |
| DH29 | v = 0.000078168 × d2 + 0.00020175 × (h – 1.3)2 + 0.000025461 × d2 × h – 0.0000000094597 × d × h2 | 383 | 0.978 | 0.068 | –0.005 |
| DH35 | v = 0.0028011 × d + 0.0059896 × (h – 1.3) + 0.000030872 × d2 × h | 383 | 0.978 | 0.066 | –0.003 |
| v = stem volume (m3); d = diameter at 1.3 m above the stump (cm); h = stem height (m). | |||||
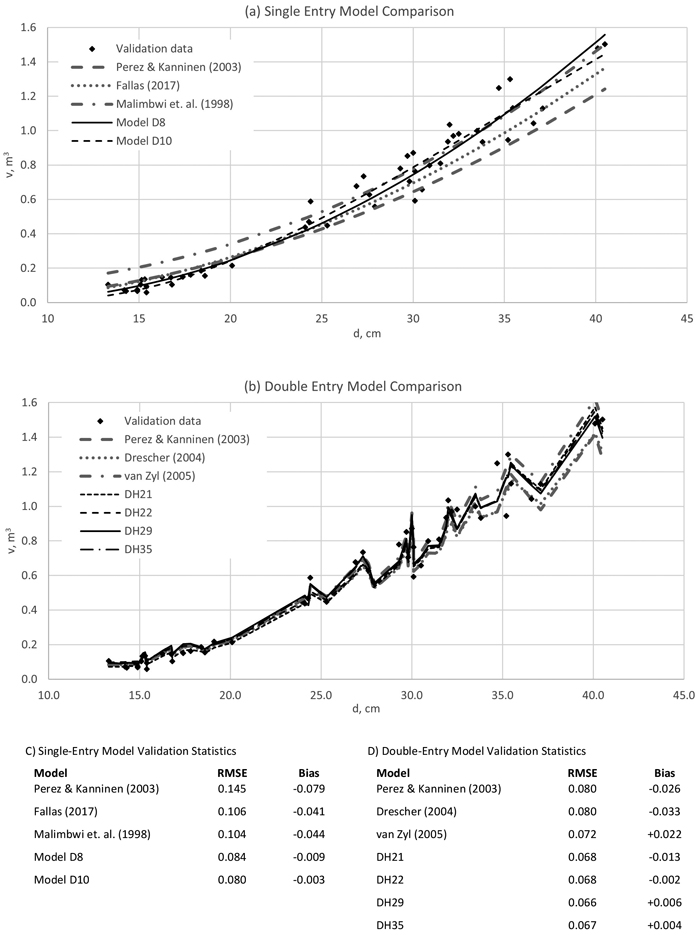
Fig. 6. Stem volume model validation with re-sampled data. Single-entry Models D8 and D10, and double-entry models DH21, DH22, DH29 and DH35 were the best performing models in this study. For details of the other published models, see Table 1 and Table 2. d = stem diameter at 1.3 m height and v = stem volume.
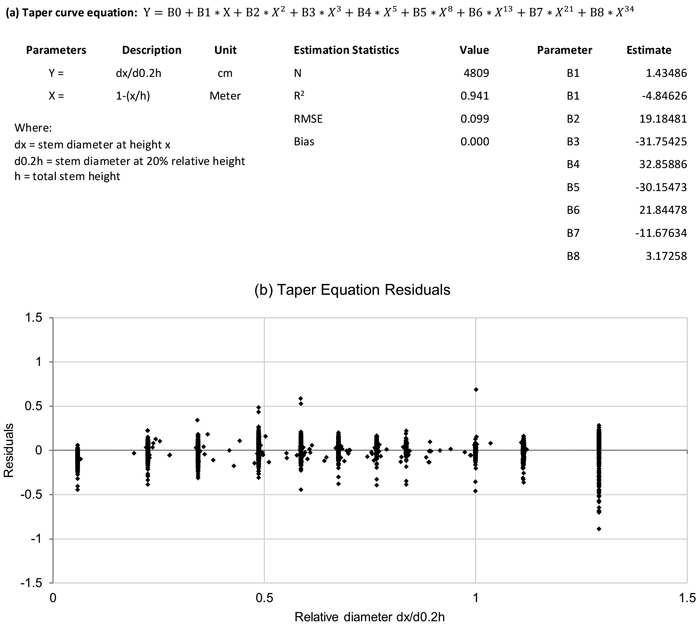
Fig. 7. Taper equation model (graph a) and residuals (graph b) (dx = diameter at height x; d0.2h = diameter at 20% relative height).
| Table 7. Summary of Yield Models A, B and C. View in new window/tab. |
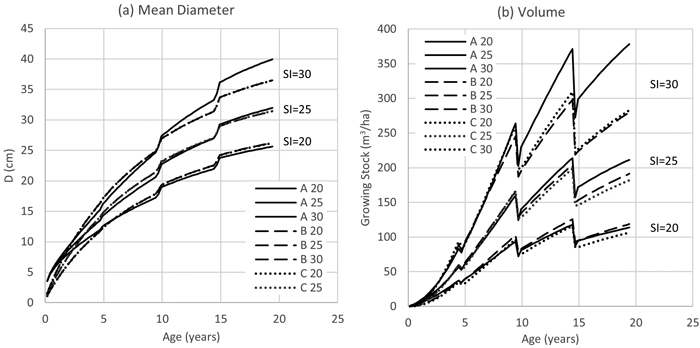
Fig. 8. Yield Model A, B and C performance with different Site Index values (D = stand mean diameter at 1.3 m height; V = stand total volume; SI = Site Index or dominant height with base age 20 years; A, B, C = volume models).
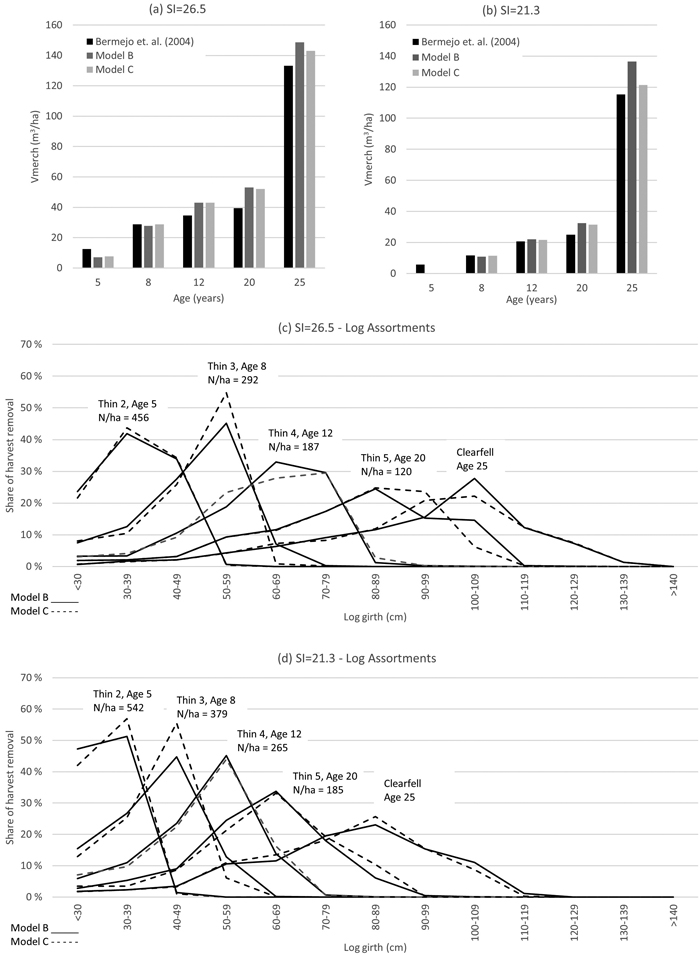
Fig. 9. Merchantable volume harvest output comparison with the study of Bermejo et al. (2004) with Site Index SI = 26.5 and SI = 21.3 (graphs a and b), and log assortments as estimated with Model B and Model C (graphs c and d).
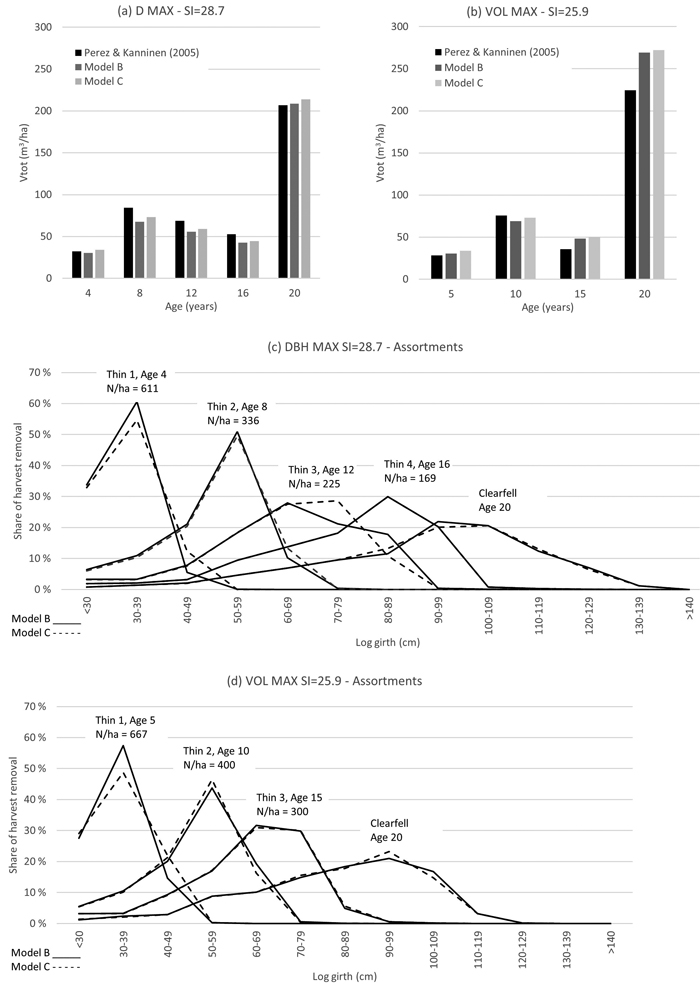
Fig. 10. Total volume harvest output comparison with the study of Perez and Kanninen (2005) with diameter maximization growth scenario (graph a) and total volume maximization growth scenario (graph b), and respective log assortments as estimated with Model B and Model C (graphs c and d).
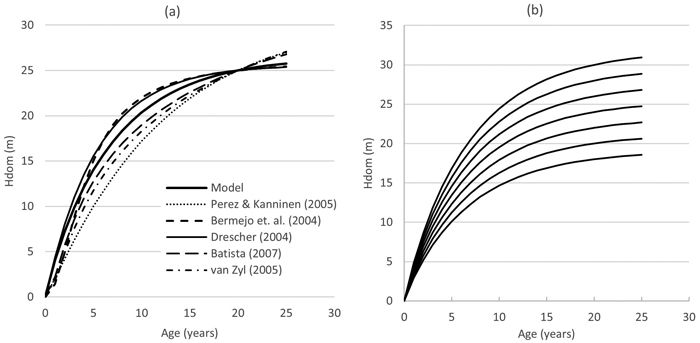
Fig. 11. Site Index curve comparison (graph a) and Model curve set for site indices 18–30 (graph b). Hd = dominant height.
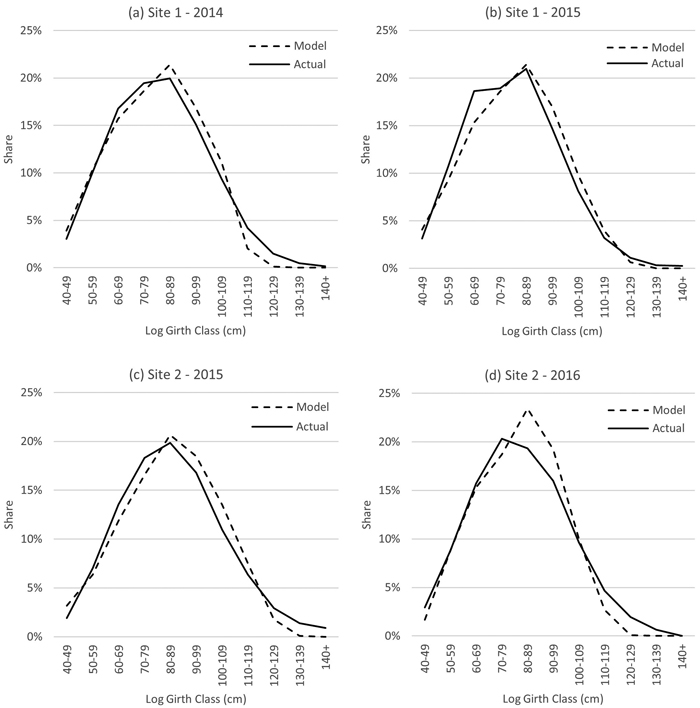
Fig. 12. Log size output comparisons (Model C predicted vs Actuals) in four final harvest operations in Panama.