| Table 1. Structural characteristics of the sample trees and surrounding relascope plots. | ||||||
| Tree | Date of collection | Tree diameter at breast height (DBH, cm) | Tree height (m) | Basal area in the plot (m2 ha–1) | Median DBH in the plot (cm) | Median height in the plot (m) |
| Birch 1 | 13.3.2019 | 13.5 | 19.0 | 22 | 17.0 | 21.2 |
| Birch 2 | 22.3.2019 | 13.5 | 15.3 | 24 | 25.0 | 16.3 |
| Spruce 1 | 22.3.2019 | 19.0 | 17.5 | 26 | 25.0 | 22.9 |
| Spruce 2 | 14.3.2019 | 19.0 | 17.2 | 24 | 24.5 | 24.2 |
| Pine 1 | 22.3.2019 | 20.5 | 16.9 | 36 | 23.0 | 17.1 |
| Pine 2 | 22.3.2019 | 13.0 | 15.2 | 42 | 23.5 | 17.2 |
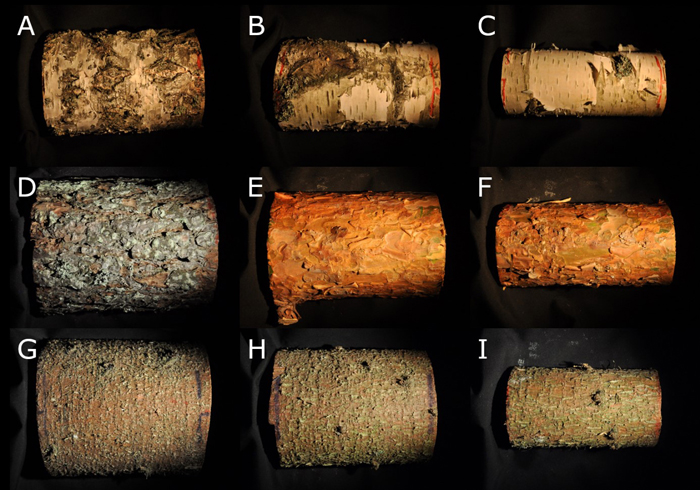
Fig. 1. Examples of silver birch (Betula pendula) (A–C), Scots pine (Pinus sylvestris) (D–F), and Norway spruce (Picea abies) (G–I ) stem bark samples from 1 m, 5 m, and 10 m heights, respectively.
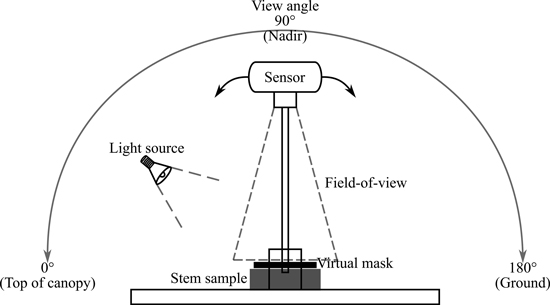
Fig. 2. Measurement set-up for the Specim IQ camera. View angle for the sensor could be set between 0–180° along the principal plane. The 0° would be top of canopy, 90° or nadir view angle was perpendicular to sample surface, and 180° was on the ground side of the sample. Small black rectangle represents the surface area of the sample used to calculate reflectance values (delineated by applying a virtual mask in the data processing). Grey rectangle represents the stem bark sample on the measurement table under the field-of-view of the sensor. One fixed light source at 40° angle (quartz tungsten halogen lamp) was used.
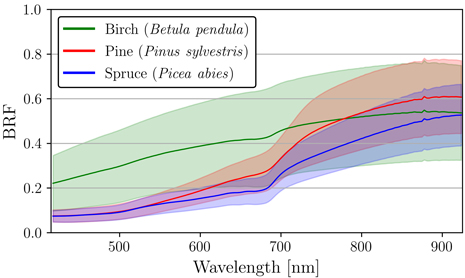
Fig. 3. Mean and standard deviation of reflectance (bi-directional reflectance factor, BRF) for silver birch (Betula pendula), Scots pine (Pinus sylvestris), and Norway spruce (Picea abies). Standard deviation was calculated between the pixel-level spectra derived from nadir measurements for each species.
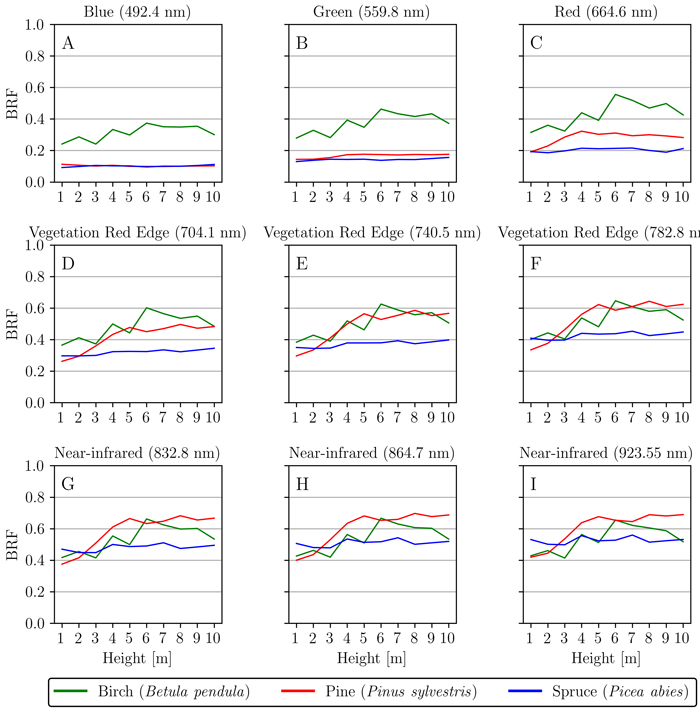
Fig. 4. Spatial variation of reflectance (bi-directional reflectance factor, BRF) along the tree height (1–10 m) for silver birch (Betula pendula), Scots pine (Pinus sylvestris), and Norway spruce (Picea abies). Nine wavelengths 492.4 nm (A), 559.8 nm (B), 664.6 nm (C), 704.1 nm (D), 740.5 nm (E), 782.8 nm (F), 834.8 nm (G), 864.7 nm (H) and 923.5 nm (I) were used to illustrate and analyze the changes in visible and near-infrared regions.
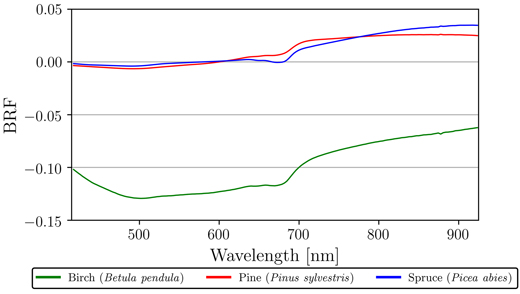
Fig. 5. Mean absolute differences in reflectance (bi-directional reflectance factor, BRF) between northern and southern sides of the measured trees for silver birch (Betula pendula), Scots pine (Pinus sylvestris), and Norway spruce (Picea abies). Measurements of north and south sides were averaged over all heights and samples per species. Order of difference: north minus south.
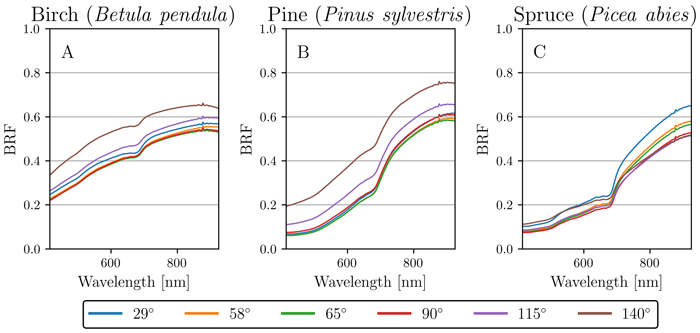
Fig. 6. Angular variation of reflectance (bi-directional reflectance factor, BRF) for silver birch (Betula pendula), Scots pine (Pinus sylvestris), and Norway spruce (Picea abies). Each plot (A, B, C) shows the mean reflectance for each measured angle (29°, 58°, 65°, 90°, 115° and 140°) per species: A) birch, B) pine, and C) spruce.
| Table 2. Relative mean percentage change of multiangular reflectance measurements for silver birch (Betula pendula), Scots pine (Pinus sylvestris), and Norway spruce (Picea abies). View angles are compared against the nadir (90°) measurements. Results are shown for three different wavelength regions: all wavelengths (415–925 nm), visible (415–925 nm), and near-infrared (415–925 nm). | |||||||||
| View angle (°) | All (415–925 nm) | Visible (415–700 nm) | Near-infrared (700–925 nm) | ||||||
| Birch | Pine | Spruce | Birch | Pine | Spruce | Birch | Pine | Spruce | |
| 29 | 6% | –4% | 32% | 7% | –6% | 35% | 5% | –0% | 26% |
| 58 | 1% | –9% | 10% | 1% | –12% | 10% | 2% | –3% | 11% |
| 65 | –1% | –10% | 6% | –1% | –13% | 6% | –1% | –4% | 7% |
| 90 | 0% | 0% | 0% | 0% | 0% | 0% | 0% | 0% | 0% |
| 115 | 12% | 26% | 6% | 14% | 35% | 10% | 10% | 10% | –2% |
| 140 | 34% | 82% | 22% | 40% | 113% | 34% | 23% | 30% | 0% |
| Table 3. Classification results for three subset scenarios using a trained support vector machine classifier on a test set. The number of spectra in both training and test sets are given for each classification model. | ||||||
| Model | Number of spectra | Classification accuracy | Overall accuracy | |||
| Training set | Test set | Birch | Pine | Spruce | ||
| Nadir | 1 886 976 | 471 477 | 96.7% | 80.1% | 92.1% | 89.6% |
| All | 9 171 456 | 2 292 864 | 96.7% | 78.6% | 91.0% | 88.8% |
| Mean | 576 | 144 | 100.0% | 92.9% | 98.1% | 97.2% |