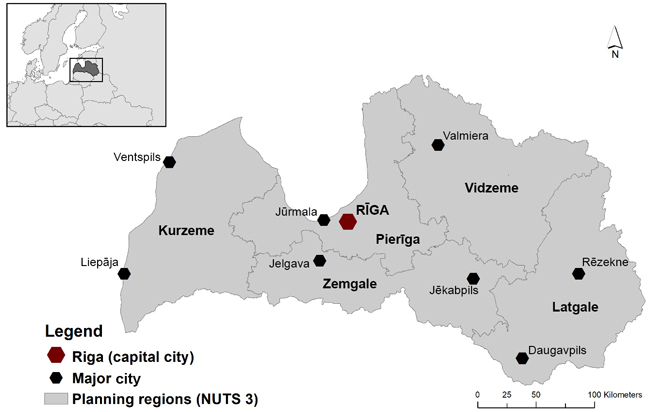
Fig. 1. Statistical regions of Latvia.
| Table 1. Characterization of population (age 15–74) in different statistical regions of Latvia in 2017 and 2018 (Central Statistical Bureau of Latvia 2019). | ||||||||
| Parameter, unit | Year | Statistical regions of Latvia | ||||||
| Rīga | Pierīga | Kurzeme | Zemgale | Latgale | Vidzeme | |||
| Population, number (thousand) | 2017 | 468.2 | 267.2 | 178.2 | 171.4 | 199.3 | 139.0 | |
| 2018 | 465.7 | 268.5 | 175.8 | 169.2 | 195.3 | 136.3 | ||
| Economically active population*, number (thousand) | total | 2017 | 336.9 | 188.4 | 118.4 | 114.9 | 127.2 | 94.5 |
| 2018 | 341.6 | 191.3 | 117.5 | 112.6 | 124.8 | 94.4 | ||
| employed | 2017 | 310.8 | 177.3 | 107.9 | 104.2 | 109.3 | 85.3 | |
| 2018 | 319.3 | 182.4 | 108.3 | 103.5 | 110.0 | 85.9 | ||
| unemployed | 2017 | 26.1 | 11.1 | 10.4 | 10.7 | 17.9 | 9.2 | |
| 2018 | 22.3 | 8.9 | 9.1 | 9.1 | 14.7 | 8.5 | ||
| Economically inactive population**, number (thousand) | 2017 | 131.3 | 78.8 | 59.8 | 56.5 | 72.1 | 44.5 | |
| 2018 | 124.1 | 77.2 | 58.3 | 56.6 | 70.5 | 41.9 | ||
| Unemployment rate, % | 2017 | 7.8 | 5.9 | 8.8 | 9.3 | 14.0 | 9.7 | |
| 2018 | 6.5 | 4.7 | 7.8 | 8.1 | 11.8 | 9.0 | ||
| Number of people with higher education, number (thousand) | 2017 | 184.7 | 83.5 | 35.2 | 38.1 | 44.1 | 26.3 | |
| 2018 | 179.8 | 83.0 | 37.5 | 37.9 | 43.8 | 29.7 | ||
| Average monthly salaries (Gross/Net), euro | 2017 | 1044/758 | 871/640 | 775/568 | 786/579 | 640/471 | 739/544 | |
| 2018 | 1129/829 | 949/705 | 858/641 | 848/634 | 701/529 | 803/604 | ||
| * Economically active population – active population consists of employed persons and unemployed persons actively seeking a job. ** Economically inactive population – persons who can neither be classified as employed nor as unemployed persons (pupils, students, non–working pensioners, etc.). | ||||||||
| Table 2. Characterization of forest in different statistical regions of Latvia (Latvian NFI data, 2015). | ||||||
| Parameter, unit | Statistical regions of Latvia | |||||
| Rīga | Pierīga | Kurzeme | Zemgale | Latgale | Vidzeme | |
| Forest area, kha | 5.27 | 550.30 | 770.91 | 428.80 | 595.99 | 889.82 |
| Forest cover, % of total land area | 17.3 | 54.3 | 56.7 | 39.9 | 41.0 | 58.3 |
| Estimated potential mean bilberry yield*, kg ha–1 | 27.6 | 13.1 | 19.3 | 10.0 | 6.8 | 8.6 |
| Estimated total bilberry yield in the statistical region**, kt | 0.15 | 7.22 | 14.90 | 4.29 | 4.05 | 7.64 |
| Estimated potential mean lingonberry yield*, kg ha–1 | 12.3 | 4.2 | 5.5 | 3.3 | 2.4 | 2.7 |
| Estimated total lingonberry yield in the statistical region**, kt | 0.06 | 2.29 | 4.23 | 1.40 | 1.45 | 2.42 |
| * Potential mean berry yields are calculated according to equations that take into consideration site type, stand age and stand density. Information on projective cover of specific berry species is obtained from the NFI data. ** Information on the cover of different forest types and their properties in the statistical region is obtained from State Forest Register. | ||||||
| Table 3. Non-wood forest product sales according to the place of origin in 2017 and 2018 in Latvia. | ||||||||||||
| Statistical regions of Latvia | Birch and maple sap | Mushrooms | Berries | |||||||||
| count | share of total count, % | count | share of total count, % | count | share of total count, % | |||||||
| 2017 | 2018 | 2017 | 2018 | 2017 | 2018 | 2017 | 2018 | 2017 | 2018 | 2017 | 2018 | |
| Kurzeme | 14 | 5 | 14 | 5 | 47 | 20 | 24 | 13 | 23 | 47 | 9 | 11 |
| Latgale | 3 | 2 | 3 | 2 | 9 | 10 | 4 | 6 | 21 | 53 | 8 | 13 |
| Vidzeme | 8 | 11 | 8 | 12 | 19 | 16 | 10 | 10 | 58 | 45 | 22 | 11 |
| Zemgale | 26 | 17 | 26 | 18 | 25 | 24 | 13 | 16 | 47 | 72 | 18 | 17 |
| Pierīga | 47 | 54 | 47 | 57 | 87 | 76 | 45 | 49 | 103 | 173 | 38 | 41 |
| Rīga | 0 | 0 | 0 | 0 | 3 | 1 | 2 | 1 | 9 | 1 | 3 | <1 |
| Unknown | 2 | 5 | 2 | 5 | 3 | 7 | 2 | 5 | 6 | 33 | 2 | 8 |
| Total | 100 | 94 | 100 | 100 | 193 | 154 | 100 | 100 | 267 | 424 | 100 | 100 |
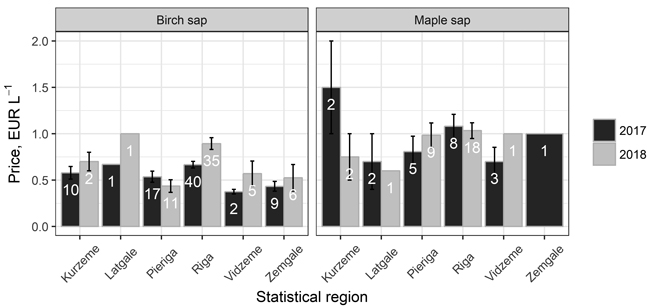
Fig. 2. Mean retail price of birch and maple sap in the 2017 and 2018 season by statistical region. White figures in the bars indicate number of cases included in the calculation of mean price.
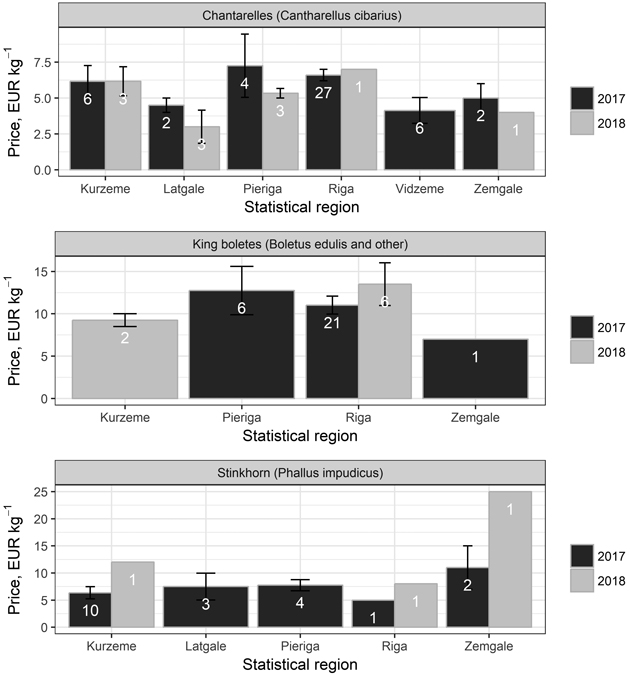
Fig. 3. Mean retail price of forest mushrooms in the 2017 and 2018 season by statistical region. White figures in the bars indicate number of cases included in the calculation of mean price.
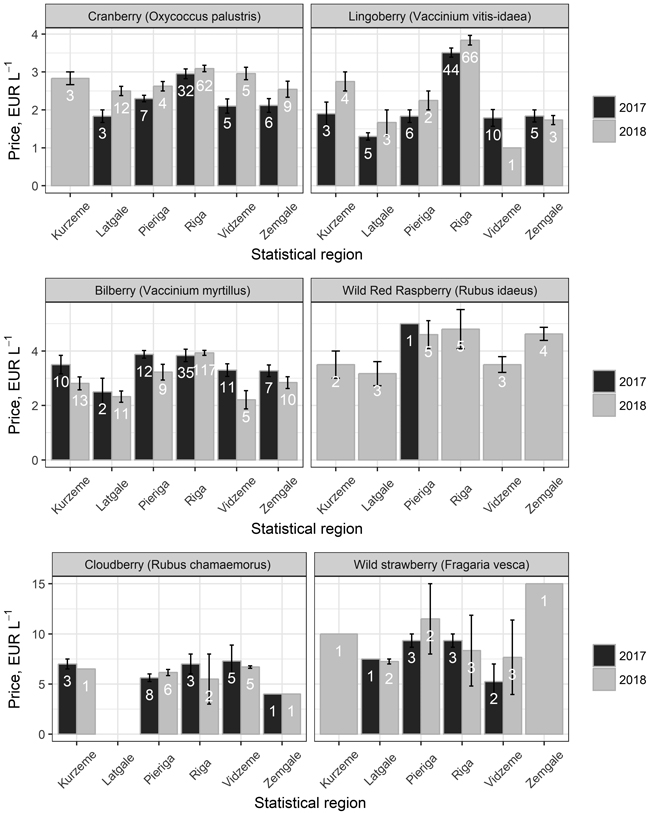
Fig. 4. Mean retail price of wild forest berries in the 2017 and 2018 season by statistical region. White figures in the bars indicate number of cases included in the calculation of mean price.
| Table 4. Changes in average price of non-wood forest products and offered amount (expressed as number of sales) in 2018 if compared to 2017 in Latvia. | ||
| Non-wood forest products | Change in average price, % | Change in offered amount, % |
| Birch sap | +22.2 | –21.5 |
| Maple sap | +2.6 | +52.4 |
| Chanterelles | –19.1 | –76.6 |
| Boletes species | +10.6 | –71.4 |
| Stinkhorn | +108.3 | –85.0 |
| Bilberry | –1.6 | +144.3 |
| Lingonberry | +26.4 | +8.2 |
| Cranberry | +11.5 | +79.2 |
| Cloudberry | –3.9 | –25.0 |
| Wild strawberry | +12.0 | +33.3 |
| Wild raspberry | –15.9 | +2100* |
| * The extremely large change is explained by very low number of cases in 2017 (n = 1) | ||
| Table 5. Correlation coefficients and p-values of linear regression model describing relations between average price of non-wood forest products and forest characteristics or socio-economic parameters in different statistical regions of Latvia in 2017 and 2018 (correlation coefficient r/p-value is shown in table; bold figures indicate r > 0.50 and p < 0.05, grey cells indicate cases when both strong correlation and statistically significant regression was detected). | ||||||||||||
| Parameter | Year | Birch sap* | Maple sap* | Chanter-elles** | Boletes species** | Stink-horn** | Bil-berry* | Lingon-berry* | Cran-berry* | Cloud-berry* | Wild straw-berry* | Wild rasp-berry* |
| Population | 2017 | 0.63/ 0.192 | 0.13/ 0.806 | 0.63/ 0.183 | 0.52/ 0.651 | –0.66/ 0.222 | 0.53/ 0.277 | 0.89/ 0.018 | 0.92/ 0.029 | 0.21/ 0.731 | 0.79/ 0.213 | - |
| 2018 | 0.31/ 0.531 | 0.47/ 0.428 | 0.67/ 0.215 | - | –0.70/ 0.510 | 0.75/ 0.011 | 0.81/ 0.028 | 0.50/ 0.315 | –0.12/ 0.852 | –0.35/ 0.730 | 0.65/ 0.177 | |
| Economically active population (total) | 2017 | 0.59/ 0.225 | 0.13/ 0.805 | 0.64/ 0.175 | 0.53/ 0.645 | –0.65/ 0.234 | 0.57/ 0.242 | 0.90/ 0.014 | 0.93/ 0.021 | 0.22/ 0.725 | 0.78/ 0.222 | - |
| 2018 | 0.27/ 0.580 | 0.51/ 0.377 | 0.69/ 0.197 | - | –0.70/ 0.510 | 0.75/ 0.010 | 0.80/ 0.031 | 0.53/ 0.281 | –0.10/ 0.871 | –0.37/ 0.737 | 0.66/ 0.164 | |
| Economically active population (employed) | 2017 | 0.57/ 0.247 | 0.14/ 0.794 | 0.66/ 0.156 | 0.55/ 0.629 | –0.64/ 0.242 | 0.60/ 0.210 | 0.90/ 0.013 | 0.94/ 0.017 | 0.21/ 0.731 | 0.78/ 0.217 | - |
| 2018 | 0.24/ 0.623 | 0.53/ 0.355 | 0.70/ 0.184 | - | –0.70/ 0.510 | 0.76/ 0.008 | 0.81/ 0.031 | 0.53/ 0.280 | –0.10/ 0.876 | –0.36/ 0.764 | 0.68/ 0.149 | |
| Economically active population (unemployed) | 2017 | 0.75/ 0.076 | <0.01/ 0.993 | 0.24/ 0.642 | 0.25/ 0.841 | –0.63/ 0.252 | 0.06/ 0.912 | 0.72/ 0.109 | 0.66/ 0.226 | 0.27/ 0.666 | 0.56/ 0.445 | - |
| 2018 | 0.73/ 0.101 | 0.11/ 0.864 | 0.35/ 0.561 | - | –0.68/ 0.522 | 0.47/ 0.182 | 0.66/ 0.120 | 0.43/ 0.395 | –0.16/ 0.796 | –0.41/ 0.383 | 0.30/ 0.594 | |
| Economically inactive population | 2017 | 0.72/ 0.113 | 0.13/ 0.810 | 0.59/ 0.215 | 0.50/ 0.668 | –0.70/ 0.192 | 0.43/ 0.399 | 0.84/ 0.036 | 0.85/ 0.066 | 0.20/ 0.748 | 0.80/ 0.197 | - |
| 2018 | 0.43/ 0.385 | 0.31/ 0.615 | 0.60/ 0.290 | - | –0.70/ 0.508 | 0.73/ 0.021 | 0.81/ 0.027 | 0.39/ 0.449 | –0.16/ 0.792 | –0.30/ 0.711 | 0.58/ 0.237 | |
| Unemployment rate | 2017 | 0.17/ 0.683 | –0.31/ 0.555 | –0.78/ 0.065 | –0.96/ 0.188 | 0.13/ 0.835 | –0.98/ <0.001 | –0.49/ 0.323 | –0.64/ 0.244 | 0.09/ 0.891 | –0.49/ 0.506 | - |
| 2018 | 0.65/ 0.188 | –0.74/ 0.157 | –0.71/ 0.183 | - | 0.80/ 0.409 | –0.70/ 0.102 | –0.49/ 0.306 | –0.31/ 0.556 | –0.03/ 0.958 | –0.04/ 0.407 | –0.77/ 0.069 | |
| Number of people with higher education | 2017 | 0.57/ 0.248 | 0.11/ 0.841 | 0.61/ 0.198 | 0.51/ 0.660 | –0.63/ 0.254 | 0.56/ 0.248 | 0.91/ 0.013 | 0.94/ 0.018 | 0.22/ 0.728 | 0.76/ 0.242 | - |
| 2018 | 0.27/ 0.580 | 0.53/ 0.357 | 0.68/ 0.206 | - | –0.68/ 0.524 | 0.74/ 0.012 | 0.79/ 0.037 | 0.55/ 0.260 | –0.11/ 0.864 | –0.38/ 0.722 | 0.66/ 0.164 | |
| Average monthly salaries (Bruto) | 2017 | 0.26/ 0.642 | 0.29/ 0.571 | 0.73/ 0.103 | 0.53/ 0.646 | –0.46/ 0.431 | 0.84/ 0.035 | 0.93/ 0.007 | 0.98/ 0.003 | 0.15/ 0.810 | 0.67/ 0.330 | - |
| 2018 | –0.10/ 0.866 | 0.73/ 0.164 | 0.86/ 0.059 | - | –0.70/ 0.502 | 0.86/ 0.003 | 0.79/ 0.040 | 0.63/ 0.183 | –0.13/ 0.838 | –0.20/ 0.860 | 0.81/ 0.056 | |
| Forest area, kha | 2017 | –0.52/ 0.289 | –0.11/ 0.838 | –0.46/ 0.353 | –0.01/ 0.992 | 0.27/ 0.661 | –0.36/ 0.487 | –0.80/ 0.060 | –0.79/ 0.103 | 0.20/ 0.748 | –0.80/ 0.205 | - |
| 2018 | –0.31/ 0.556 | –0.33/ 0.593 | –0.41/ 0.492 | - | 0.28/ 0.816 | –0.86/ 0.029 | –0.22/ 0.088 | –0.75/ 0.673 | 0.56/ 0.327 | –0.14/ 0.796 | –0.75/ 0.088 | |
| Forest cover, % of total land area | 2017 | –0.56/ 0.250 | –0.04/ 0.935 | –0.18/ 0.728 | 0.17/ 0.892 | 0.29/ 0.636 | –0.09/ 0.861 | –0.68/ 0.092 | –0.74/ 0.203 | 0.08/ 0.897 | –0.56/ 0.438 | - |
| 2018 | –0.55/ 0.261 | –0.16/ 0.798 | –0.24/ 0.701 | - | 0.31/ 0.802 | –0.68/ 0.139 | –0.26/ 0.165 | –0.65/ 0.624 | 0.54/ 0.343 | 0.06/ 0.905 | –0.52/ 0.294 | |
| Potential mean berry yield, kg ha–1 | 2017 | - | - | - | - | - | 0.69 /0.131 | 0.97 /0.001 | *** | *** | *** | *** |
| 2018 | - | - | - | - | - | 0.86 /0.027 | 0.93 /0.008 | *** | *** | *** | *** | |
| Estimated total berry yield, kt | 2017 | - | - | - | - | - | 0.06 /0.906 | –0.53 /0.277 | *** | *** | *** | *** |
| 2018 | - | - | - | - | - | –0.40 /0.427 | –0.27 /0.604 | *** | *** | *** | *** | |
| * Price per 1 L. ** Price per 1 kg. *** No data on potential berry yields available. | ||||||||||||
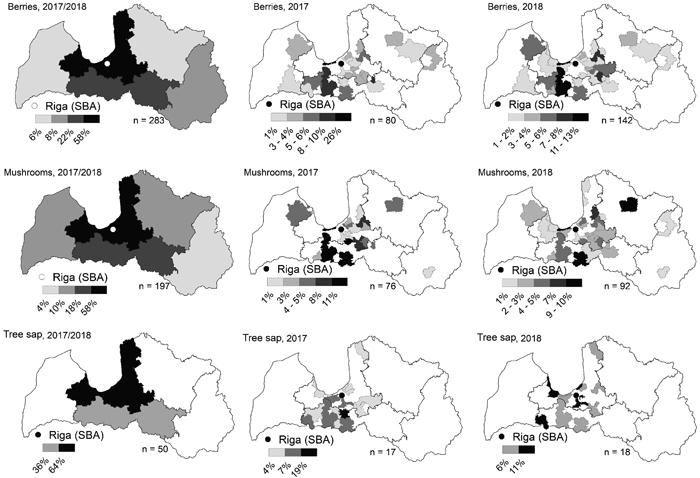
Fig. 5. Main non-wood forest product flows from ecosystem service providing units (statistical regions and counties) to the marketplaces in Rīga in 2017 and 2018. n – number of cases used for flows analysis. Different division in percentages correspond to data structure of every product and year. View larger in new window/tab.
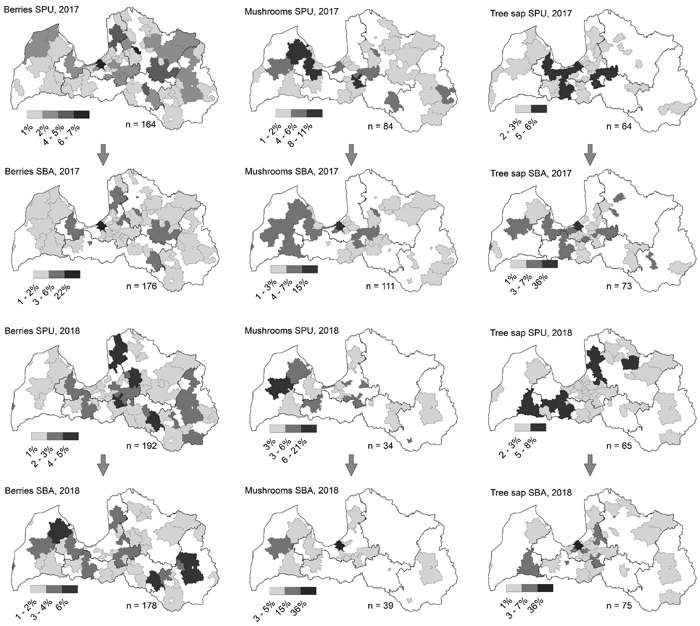
Fig. 6. Main non-wood forest product flows from ecosystem service providing units (SPU) to the service benefitting area (SBA) excluding sales at marketplaces in Rīga at county level in 2017 and 2018 in Latvia. n – number of cases used for flows analysis. Different division in percentages correspond to data structure of every product and year. View larger in new window/tab.
| Table 6. Characteristics of distances to transport non-wood forest product from service providing units (SBU) to service benefitting area (SBA) in 2017 and 2018 in Latvia. | ||||||
| Flow of NWFPs | Cases when NWFPs were transported outside SPU county borders (number/ share)* | Characteristics of distance, km | ||||
| Average value (± S.E.) | Minimum value | Maximum value | Median | Mode | ||
| From SPU to the marketplaces in Rīga | 440/ 100% | 63.1 (1.8) | 14 | 261 | 52.5 | 37 |
| From SPU to SBA in cases when NWFPs were transported outside SPU county borders* | 221/ 37% | 59.7 (3.4) | 6 | 250 | 41 | 30 |
| * SPU and SBA does not match. NWFPs – non-wood forest products. SPU – service providing units. SBA – service benefitting area. | ||||||