| Table 1. Characteristics of the research area on which we tested the effect of slope gradient on the mental workload of the harvester operator. | |
| Location | Azienda La Dogana |
| Municipality | Barberino di Mugello |
| Province | Firenze |
| Coordinates | 44°03´N, 11°14´E |
| Category of cutting | Late thinning |
| Species | Douglas fir |
| Age [years] | 50 |
| Density [trees ha–1] | 910 |
| Stocking [m3 ha–1] | 650 |
| Mean removal tree DBH [cm] | 24 |
| Mean tree height [m] | 25 |
| Mean trunk volume of removed tree [m3] | 0.48 |
| Slope [%] | 9–47 |
| Table 2. Technical data of the Tobii Pro Glasses 2 Eye-tracker. | |
| Eye-tracker | |
| Sampling frequency | 50–100 Hz (in respect to eye-trackers the sampling frequency means the number of identified locations of fixation points per second; this frequency determines the quality of results and the accuracy of measurements) |
| Cameras | 4 |
| Scene camera FOV | 82° horizontally, 52° vertically |
| Scene camera parameters | h.264; 1920 × 1080 pixels; @25 fps |
| Field of view | 160° |
| Diagonal of scene camera FOV | 90°; 16:9 |
| Sound recording | Yes |
| Weight | 45 g |
| Battery | 120 min |
| Recording Station | |
| Connection | HDMI, Micro USB, 3.5 mm Jack |
| Frequency | 2.4 GHz & 5 GHz band |
| Dimensions | 130 × 85 × 27 mm |
| Weight | 312 g |
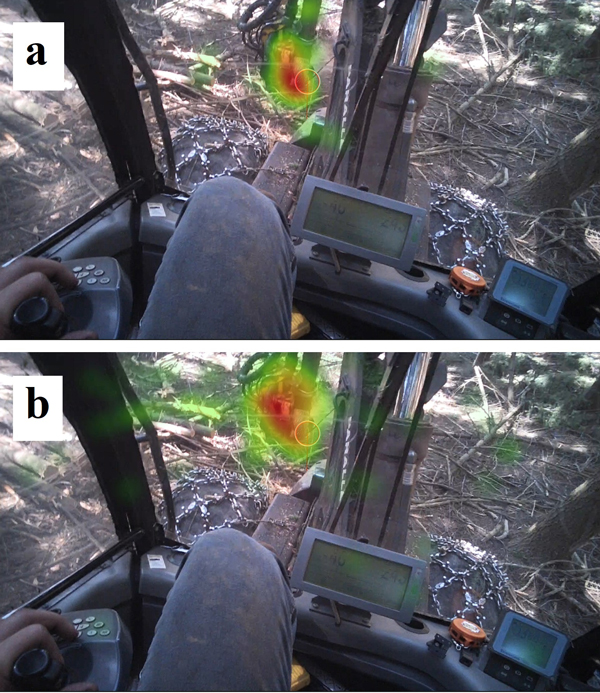
Fig. 1. Tree cutting with the harvester on a 9% (a) and 47% (b) slope with heat maps of fixation points – when the eyeballs are in a state of relative rest and visual information is retrieved from the environment.
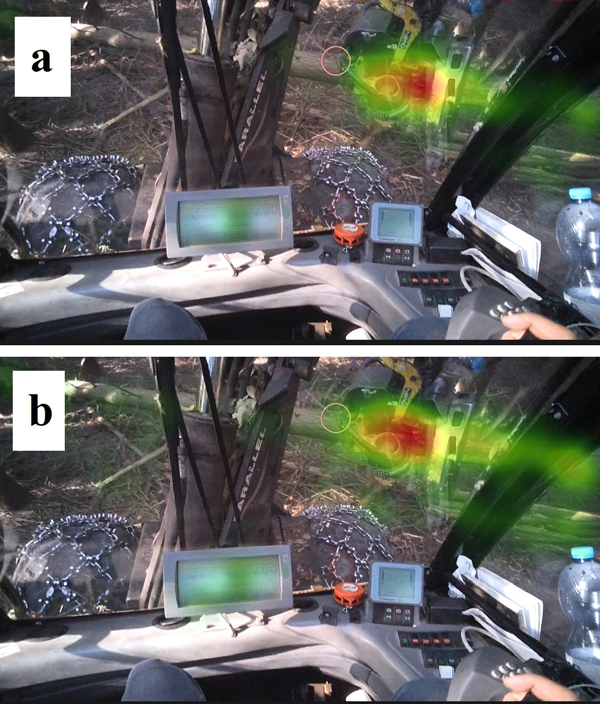
Fig. 2. Tree processing with the harvester on a 9% (a) and 47% (b) slope with heat maps of fixation points – when the eyeballs are in a state of relative rest and visual information is retrieved from the environment.
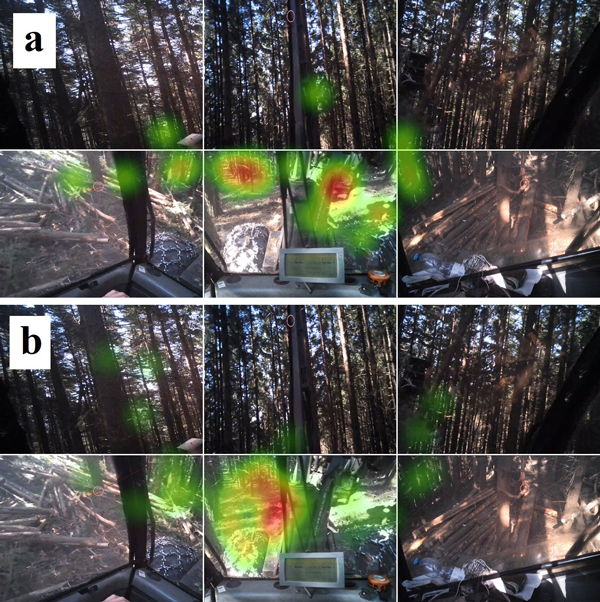
Fig. 3. The harvester moving on a 9% (a) and 47% (b) slope with heat maps of fixation points – when the eyeballs are in a state of relative rest and visual information is retrieved from the environment.
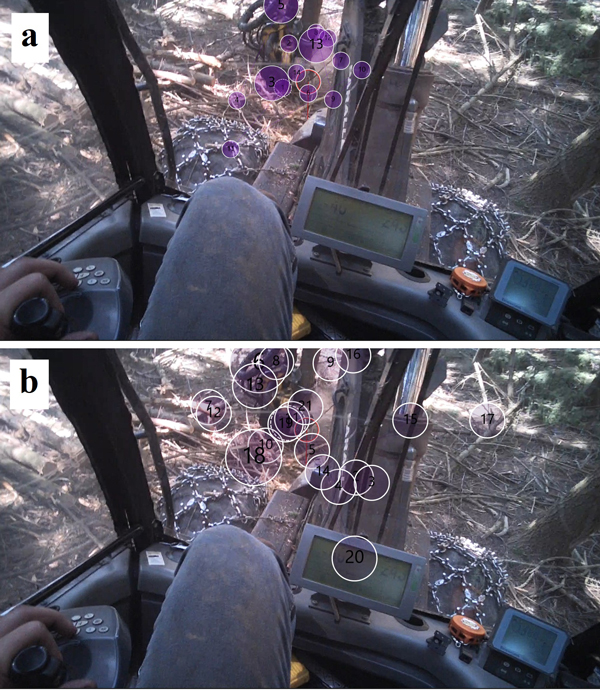
Fig. 4. Tree cutting with the harvester on a 9% (a) and 47% (b) slope with a gaze plot, showing the trajectories of fast movements between fixation points.
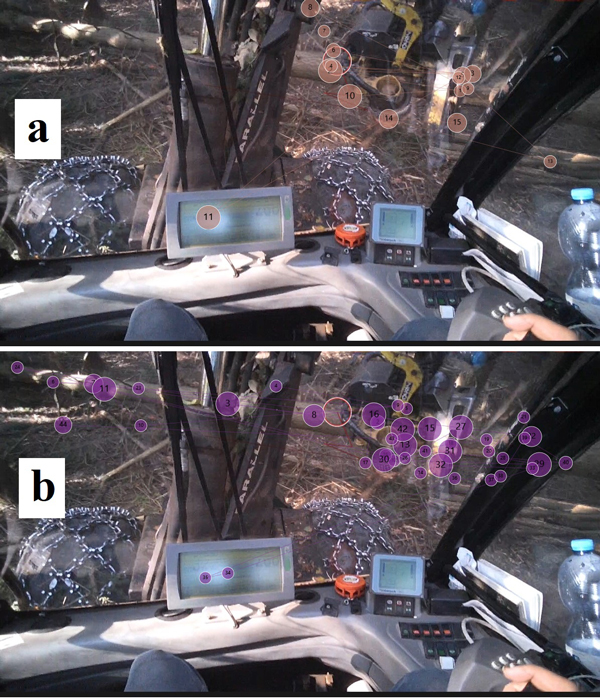
Fig. 5. One log of a tree processed with the harvester on a 9% (a) and 47% (b) slope with a gaze plot, showing the trajectories of fast movements between fixation points.
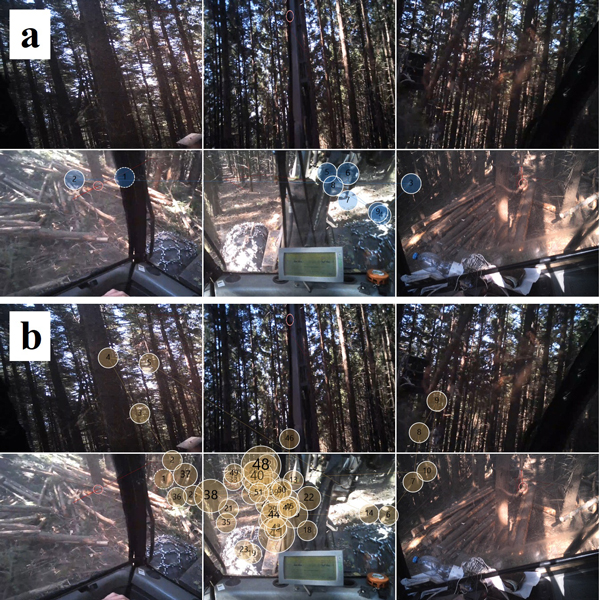
Fig. 6. The harvester moving on a 9% (a) and 47% (b) slope with a gaze plot, showing the trajectories of fast movements between fixation points.
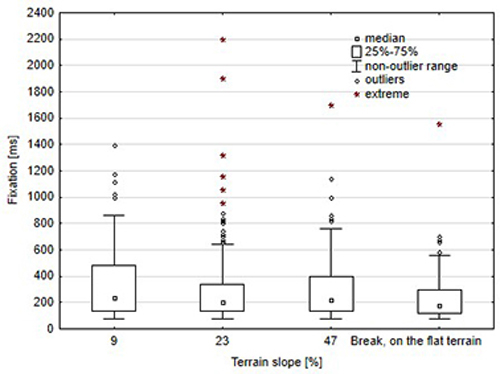
Fig. 7. Duration of the harvester operator’s fixation during work in the stand with the analysed slope gradients.
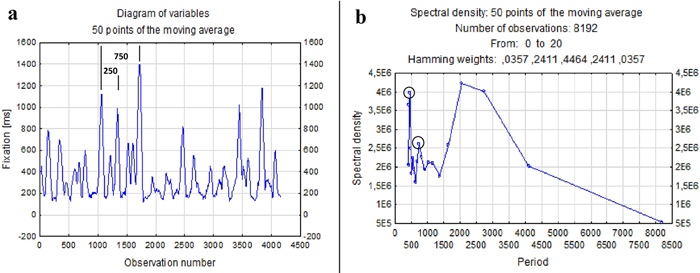
Fig. 8. A fragment of a time series (a) and a periodogram – entire database (b) of fixation duration during the harvester operator’s work in the terrain with 9% slope gradient. View larger in new window/tab.
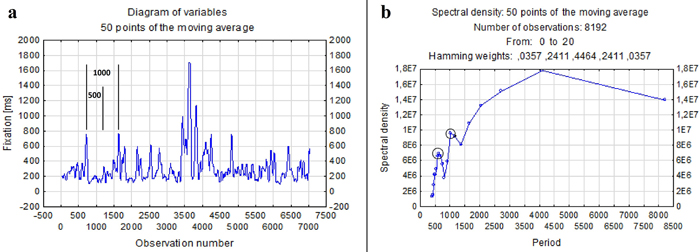
Fig. 9. A fragment of a time series (a) and a periodogram – entire database (b) of fixation duration during the harvester operator’s work in the terrain with 47% slope gradient. View larger in new window/tab.
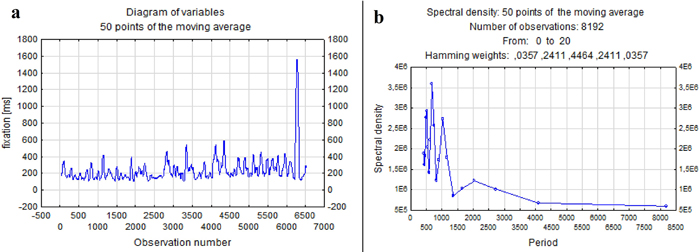
Fig. 10. A fragment of a time series (a) and a periodogram – entire database (b) of fixation duration during the harvester operator’s rest period. View larger in new window/tab.