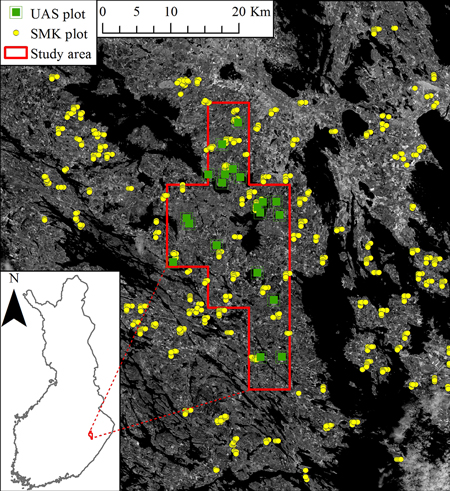
Fig. 1. Location of the species-specific volume prediction study area and field plots in Finland. Sentinel-2 SWIR2 band (b12) background. UAS means unmanned aircraft system, SMK means Finnish Forest Centre.
| Table 1. Mean and standard deviation (in parentheses) of the main forest attributes of the validation field plots and Finnish Forest Centre (SMK) plots. The SMK field plots are used only to predict the tree species proportions. The validation field plots are used to evaluate the performance of predictions. DGM is the diameter of the basal area median tree. Dominance is the percentage of a tree species with respect to the summed volumes of all tree species. | |||||
| Volume (m3 ha–1) | Lorey’s height (m) | DGM (cm) | Dominance (%) | ||
| Pine | Validation | 59.5 (100.2) | 18.3 (7.2) | 22.9 (7.1) | 24.8 |
| SMK | 80.0 (100.6) | 17.8 (5.7) | 21.7 (8.4) | 36.3 | |
| Spruce | Validation | 133.7 (132.1) | 18.6 (7.8) | 18.4 (10.1) | 55.8 |
| SMK | 98.0 (134.7) | 14.5 (6.7) | 17.5 (9.3) | 44.5 | |
| Broadleaved | Validation | 46.5 (64.9) | 18.8 (6.9) | 16.8 (8.4) | 19.4 |
| SMK | 42.2 (63.8) | 15.6 (5.5) | 14.9 (7.8) | 19.2 | |
| Total | Validation | 239.6 (132.5) | 21.2 (6.2) | 22.4 (7.2) | 100.0 |
| SMK | 220.8 (122.0 | 17.8 (5.0) | 20.9 (7.4) | 100.0 | |
| Table 2. Spectral bands for the Sentinel-2B sensors used in the prediction of tree species proportions. | |||
| Band | Central Wavelength (nm) | Bandwidth (nm) | Resolution (m) |
| 1 – Coastal aerosol | 442.2 | 21 | 60 |
| 2 – Blue (B) | 492.1 | 66 | 10 |
| 3 – Green (G) | 559.0 | 36 | 10 |
| 4 – Red (R) | 664.9 | 31 | 10 |
| 5 – Red edge 1 (RE1) | 703.8 | 16 | 20 |
| 6 – Red edge 2 (RE2) | 739.1 | 15 | 20 |
| 7 – Red edge 3 (RE3) | 779.7 | 20 | 20 |
| 8 – Near infrared (NIR) | 832.9 | 106 | 10 |
| 8a – Near infrared narrow (NIRn) | 864.0 | 22 | 20 |
| 9 – Water vapor | 943.2 | 21 | 60 |
| 10 – Shortwave infrared / Cirrus | 1376.9 | 30 | 60 |
| 11 – Shortwave infrared 1 (SWIR1) | 1610.4 | 94 | 20 |
| 12 – Shortwave infrared 2 (SWIR2) | 2185.7 | 185 | 20 |
| Table 3. Satellite image features used in the prediction of tree species proportions. Subscript b1–12 denotes band number; band wavelengths are explained in Table 2. Subscript July denotes that the feature is computed from a July image, Sep denotes that the feature is computed from a September image. | |
| Feature abbreviation | Explanation |
| mean(b1–12)July, Sep | Mean |
| ratio(b1–12)July, Sep | Ratio of bands (b1–12)July, Sep / (b1–12)July, Sep |
| Table 4. Top 10 most important Sentinel-2 features for the prediction of tree species proportions with k nearest neighbor (k-NN) imputation. Tree species proportions are used in the prediction of volumes by tree species. Frequency indicates the proportion of the models from 1000 iterations of variable selection that contained that variable. Variables are described in Table 2. | |
| Feature | Frequency (%) |
| 1 – (SWIR2)July | 81.8 |
| 2 – (SWIR2)July / (R)Sep | 31.3 |
| 3 – (R)Sep | 29.2 |
| 4 – (R)Sep / (G)Sep | 26.0 |
| 5 – (SWIR2)July / (B)Sep | 24.1 |
| 6 – (SWIR2)July / (RE1)Sep | 24.0 |
| 7 – (R)Sep / (RE2)Sep | 23.3 |
| 8 – (G)Sep / (RE2)Sep | 22.9 |
| 9 – (R)Sep / (NIRn)Sep | 22.8 |
| 10 – (B)Sep / (NIR)Sep | 22.0 |
| Table 5. Absolute and relative root mean square error (RMSE) and mean difference (MD) values associated with tree species-specific volume proportions in the validation data using k nearest neighbor (k-NN) imputation. p.p. denotes percentage point. | ||||
| RMSE (p.p.) | RMSE (%) | MD (p.p.) | MD (%) | |
| Pine | 17.9 | 63.8 | 6.2 | 22.3 |
| Spruce | 18.7 | 39.1 | –6.2 | –13.0 |
| Broadleaved | 10.6 | 43.9 | –0.02 | –0.09 |
| Table 6. Absolute and relative root mean square error (RMSE) and mean difference (MD) values associated with volumes by tree species and total volume in the validation data. | ||||
| RMSE (m3 ha–1) | RMSE (%) | MD (m3 ha–1) | MD (%) | |
| Pine | 37.4 | 62.6 | 7.0 | 11.8 |
| Spruce | 44.8 | 33.4 | –13.4 | –10.0 |
| Broadleaved | 24.2 | 51.9 | 2.0 | 4.4 |
| Total | 21.7 | 9.0 | 3.3 | –0.8 |
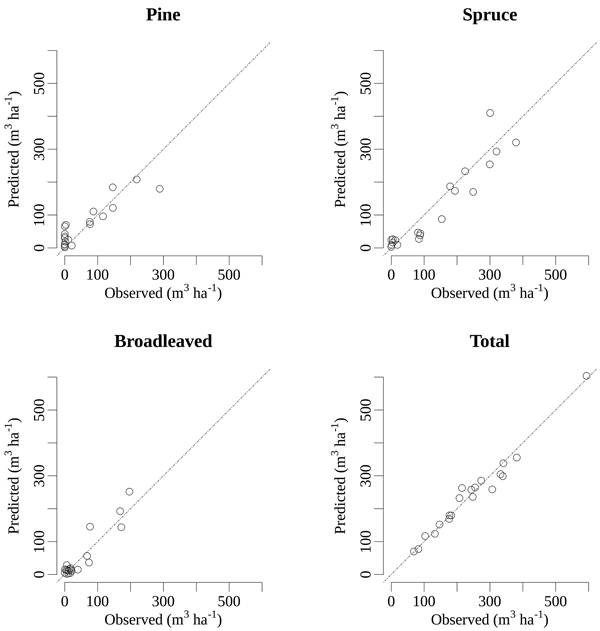
Fig. 2. Visual accuracy assessment using scatterplots of predicted and observed volumes by tree species and total volume in the validation field plots. The diagonal dashed line indicates a perfect prediction. Volumes are predicted using photogrammetric UAS data, Sentinel-2 images and prior field measurements.