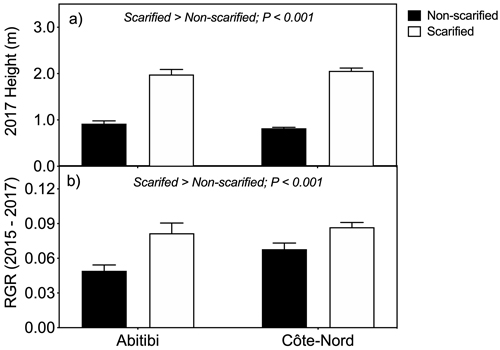
Fig. 1. Tree height (a) and relative growth rate (RGR) (b) of black spruce trees on non-scarified and scarified plots, at two boreal sites in Québec. Trees were planted as containerized 2-year-old seedlings in 1999. Two way mixed model ANOVA revealed a significant (P < 0.001) effect of scarification on tree height and RGR across both sites (N = 250 trees per treatment across sites). Vertical lines denote standard errors of the means (n = 90 in Abitibi; n = 160 in Côte-Nord).
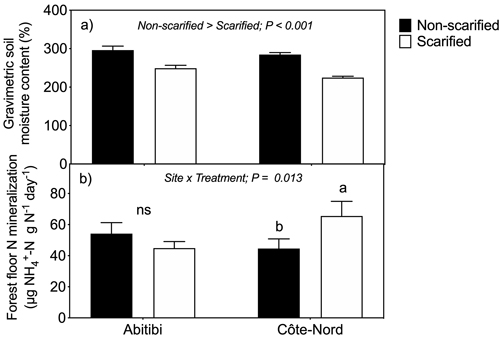
Fig. 2. Forest floor gravimetric moisture content (a) and nitrogen mineralization rate per total N (b) in non-scarified and scarified plots at two boreal sites in Québec. Each bar represents mean values based on 3 bulk samples × 5 plots × 4 sampling dates (n = 60). Two way mixed model ANOVA revealed a significant (P < 0.001) main effect of treatment on forest floor moisture content (Fig. 2a). In the case of N mineralization (Fig. 2b), a significant site × treatment interaction required us test the effects of scarification within each site; consequently, statistically different (P = 0.037) means were found in Côte-Nord (different lower-case letters), but not in Abitibi (ns = not significant). Vertical lines denote standard errors of the means.
| Table 1. Mean gas exchange and foliar nitrogen measurements of one-year-old black spruce needles in scarified and non-scarified plots in two sites of Québec, 18 years after treatment. Trees were planted as containerized 2-year old seedlings in 1999. The reported treatment means are based on 2 trees × 5 plots × 4 sampling dates (n = 40). The reported P values result from two-way mixed model analyses of variance testing the effects of treatments and sites, as well as their interaction. Values in parentheses denote one standard error of the mean. | |||||
| Abitibi | Côte-Nord | Significant findings | |||
| Non-scarified | Scarified | Non-scarified | Scarified | ||
| Pn | 9.58 (0.90) | 8.92 (0.76) | 9.15 (0.98) | 6.75 (0.92) | Non-scarified > Scarified; (P = 0.087) |
| A | 0.033 (0.003) | 0.032 (0.003) | 0.025 (0.002) | 0.022 (0.002) | Abitibi > Côte-Nord; (P = 0.027) |
| E | 4.39 (0.61) | 3.00 (0.29) | 4.52 (0.43) | 3.84 (0.40) | Non-scarified > Scarified; (P < 0.003) |
| Foliar N | 7.13 (0.23) | 6.83 (0.22) | 6.90 (0.21) | 7.50 (0.18) | Site x Treatment; (P = 0.087) |
| Pn: CO2 exchange rate per needle area (µmol CO2 m2 s–1), A: CO2 exchange rate per needle mass (µmol CO2 g–1 s–1), E: transpiration (mmol H2O m–2 s–1), Foliar N: foliar nitrogen concentration (mg N g–1) | |||||
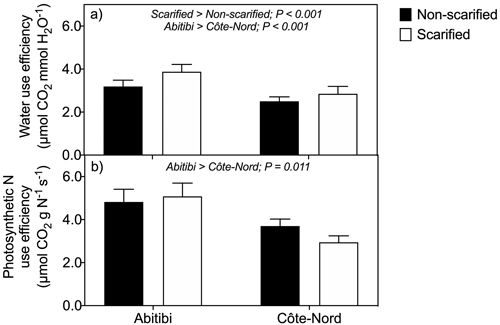
Fig. 3. Instantaneous water use efficiency (a) and photosynthetic nitrogen use efficiency (b) of black spruce trees on non-scarified and scarified plots, at two boreal sites in Québec. Trees were planted as containerized 2-year-old seedlings in 1999. Each bar represents mean values based on 2 trees × 5 plots × 4 sampling dates (n = 40). Two way mixed model ANOVA revealed significant main effects of treatments (P < 0.001) and sites (P < 0.001) on water use efficiency (Fig. 3a), and a significant effect of sites (P = 0.011) on photosynthetic nitrogen use efficiency (Fig. 3b).Vertical lines denote standard errors of the means.
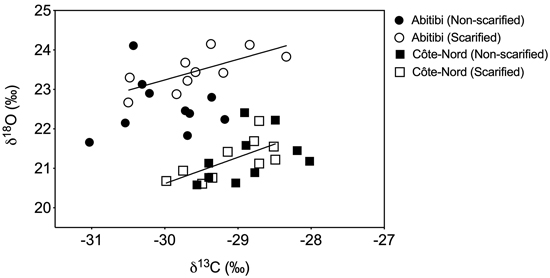
Fig. 4. Results of linear regression analysis testing the relationship between δ18O and δ13C isotopic values of one-year-old needles in non-scarified (closed symbols) and scarified (open symbols) plots, at two boreal sites in Québec. Needles were collected from two black spruce trees per plot, in September 2016 (n = 10). Trees were planted as containerized 2-year-old seedlings in 1999. We found a significant positive regression slope (solid line) on scarified plots only, on both the Abitibi (P = 0.021, R2 = 0.51) and the Côte-Nord (P = 0.024, R2 = 0.49) sites.