| Table 1. Allocation of sawn wood and wood-based panels into functional unit groups is derived from the Forecon report (2018) on current consumption. Birch allocation in other than plywood is based on the authors’ judgements. The allocation is used to establish the current consumption pattern. The pattern is then used to estimate the resulting displacement effect of the functional unit groups for which displacement factors were selected. |
| Product category | Functional unit group | Pine | Spruce | Birch |
| Sawn wood | Structural elements | 27% | 34% | |
| Non-structural elements | 53% | 41% | 100% |
| Short-lived use | 20% | 25% | |
| Particle board | Structural elements | 47% | 47% | |
| Non-structural elements | 45% | 45% | |
| Short-lived use | 7% | 7% | |
| Fiberboard | Structural elements | 57% | 57% | |
| Non-structural elements | 36% | 36% | |
| Short-lived use | 5% | 5% | |
| Plywood | Structural elements | | 29% | 64% |
| Non-structural elements | | 16% | 36% |
| Short-lived use | | 55% | |
| Table 2. Carbon content and the resulting displacement effect by 1) dominant tree species and 2) functional unit groups according to the BAU scenario (i.e. current production volumes and consumption pattern). |
| Functional unit | Mass (Tg) | C Content (Tg) | Displacement effect (Tg C) |
| Pine | Structural element | 0.75 | 0.38 | 0.50 |
| Non-structural element | 1.30 | 0.66 | 1.06 |
| Short-lived use | 0.49 | 0.25 | 0.10 |
| Sub total | | 2.53 | 1.29 | 1.65 |
| Spruce | Structural element | 0.97 | 0.49 | 0.64 |
| Non-structural element | 0.93 | 0.48 | 0.76 |
| Short-lived use | 0.71 | 0.36 | 0.14 |
| Sub total | | 2.60 | 1.33 | 1.55 |
| Birch | Structural element | 0.14 | 0.07 | 0.09 |
| Non-structural element | 0.11 | 0.05 | 0.08 |
| Sub total | | 0.25 | 0.12 | 0.17 |
| Table 3. Aggregated displacement factor values and total displacement effect amounts in the examined scenarios based on the allocation of wood material into the functional unit groups. |
| Tree species | Scenario | Displacement
factor | Displacement effect (Tg C) |
| Pine | BAU | 1.28 | 1.7 |
| Potential | 1.28 | 1.7 |
| WEM 2030 | 1.28 | 1.8 |
| WEM 2050 | 1.28 | 2.2 |
| 2003 | 1.28 | 2.0 |
| 2009 | 1.28 | 1.2 |
| Spruce | BAU | 1.16 | 1.5 |
| Potential | 1.19 | 1.6 |
| WEM 2030 | 1.16 | 1.7 |
| WEM 2050 | 1.16 | 2.0 |
| 2003 | 1.17 | 1.9 |
| 2009 | 1.17 | 1.1 |
| Birch | BAU | 1.43 | 0.2 |
| Potential | 1.43 | 0.2 |
| WEM 2030 | 1.43 | 0.2 |
| WEM 2050 | 1.43 | 0.2 |
| 2003 | 1.43 | 0.2 |
| 2009 | 1.43 | 0.1 |
| Table 4. Comparison of the scenario results against those of BAU, by 1) tree species and 2) functional unit group. Results are given for 1) the total amount of wood material and 2) the resulting displacement effect. |
| BAU reference | Potential | WEM 2030 | WEM 2050 | 2003 | 2009 |
| m3 | Mg CO2 | m3 | Mg CO2 | m3 | Mg CO2 | m3 | Mg CO2 | m3 | Mg CO2 | m3 | Mg CO2 |
| Pine |
| 1.* | 1.62 | 1.82 | 0.19 | 0.21 | 0.12 | 0.14 | 0.48 | 0.53 | 0.32 | 0.36 | –0.44 | –0.49 |
| 2. | 2.81 | 3.87 | –0.14 | –0.20 | 0.24 | 0.32 | 0.92 | 1.26 | 0.62 | 0.85 | –0.84 | –1.16 |
| 3. | 1.05 | 0.36 | –0.05 | –0.02 | 0.09 | 0.03 | 0.34 | 0.12 | 0.23 | 0.08 | –0.32 | –0.11 |
| Sub total | 5.49 | 6.05 | 0.00 | 0.00 | 0.45 | 0.49 | 1.74 | 1.91 | 1.17 | 1.29 | –1.60 | –1.76 |
| Spruce |
| 1. | 2.35 | 2.34 | 0.10 | 0.10 | 0.19 | 0.19 | 0.70 | 0.70 | 0.42 | 0.42 | –0.66 | –0.66 |
| 2. | 2.28 | 2.80 | 0.04 | 0.05 | 0.20 | 0.24 | 0.77 | 0.95 | 0.49 | 0.60 | –0.74 | –0.91 |
| 3. | 1.72 | 0.53 | –0.14 | –0.04 | 0.20 | 0.06 | 0.62 | 0.19 | 0.33 | 0.10 | –0.57 | –0.17 |
| Sub total | 6.35 | 5.67 | 0.00 | 0.10 | 0.59 | 0.49 | 2.10 | 1.84 | 1.24 | 1.12 | –1.97 | –1.74 |
| Birch |
| 1. | 0.25 | 0.33 | 0.00 | 0.00 | 0.05 | 0.07 | 0.11 | 0.14 | 0.02 | 0.03 | –0.08 | –0.11 |
| 2. | 0.18 | 0.30 | 0.00 | 0.00 | 0.03 | 0.05 | 0.07 | 0.12 | 0.02 | 0.03 | –0.06 | –0.10 |
| Sub total | 0.43 | 0.62 | 0.00 | 0.00 | 0.08 | 0.12 | 0.18 | 0.26 | 0.04 | 0.06 | –0.14 | –0.20 |
| Total | 12.27 | 12.34 | 0.00 | 0.10 | 1.11 | 1.10 | 4.01 | 4.01 | 2.46 | 2.48 | –3.71 | –3.71 |
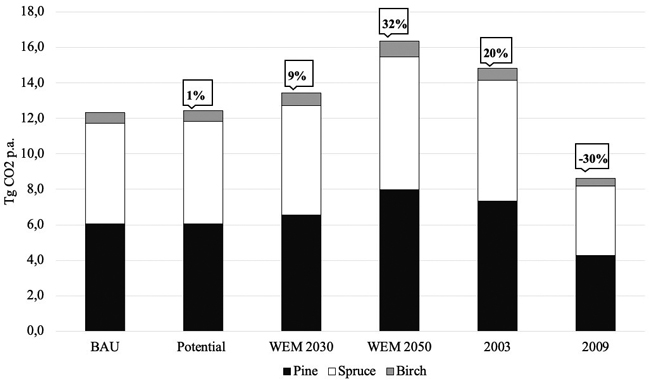
Fig. 1. Total annual displacement effect (Tg CO2) by scenario and tree species in Finland for total annual production of sawn wood and wood-based panels. Comparison to BAU is given in percentages.