| Table 1. Variables for the models, their symbols, and units. | ||
| Variable | Symbol | Unit |
| Plot size | Plotsize | m2 |
| Cumulative annual daily mean temperatures above +5 °C | DDY | degree days (d.d.) |
| Height above sea level | Altitude | m |
| Slope | Slope | % |
| Latitude | Latitude | min |
| Mean total age of stand | Age | years |
| Number of stems | N | N ha–1 |
| Basal area | BA | m2 ha–1 |
| Mean diameter, basal area weighted | DG | cm |
| Basal area of pine trees | BApine | m2 ha–1 |
| Basal area of spruce trees | BAspruce | m2 ha–1 |
| Basal area of broadleaved trees | BAbrd | m2 ha–1 |
| Proportion of pine basal area of total basal area | BApineRel | |
| Proportion of broadleaved basal area of total basal area | BAbrdRel | |
| Number of dead tree stems | N_dead | N ha–1 |
| Basal area of dead trees | BA_dead | m2 ha–1 |
| Mean diameter of dead trees, basal area weighted | DG_dead | cm |
| Occurence of mortality | mortality | {0, 1} |
| Soil type peatland | PEAT | {0, 1} |
| Aspect between 225 and 315 degrees, when max was 360 | WEST | {0, 1} |
| Growth period between measurements | Period | years |
| Thinning within 5 years of the studied period | TH5 | {0, 1} |
| Quadratic mean diameter, √(BA/qN) | DQ | cm |
| Occurrence of mortality: 0 = mortality occur; 1 = no mortality occur; Peatland: 0 = no peatland, 1 = peatland; Western aspect: 0 = no western aspect, 1 = western aspect; Thinning within 5 yrs: 0 = not thinned, 1 = thinned | ||
| Table 2. Description of combined Swedish and Norwegian NFI data for modelling the occurrence of no mortality. | ||||||
| Data set | SWEDEN (n = 16 459 ) | NORWAY (n = 11 767) | ||||
| Variable | mean | min | max | mean | min | max |
| Plotsize, m2 | 314.2 | 314.2 | 314.2 | 250.0 | 250.0 | 250.0 |
| DDY, d.d. | 1133.6 | 426.8 | 1760.4 | 881.1 | 303.5 | 2049.3 |
| Altitude, m | 228.7 | 0.0 | 787.0 | 379.4 | 0.0 | 1080.0 |
| Slope, % | 4.8 | 0.0 | 41.5 | 25.0 | 0.0 | 150.0 |
| Latitude, min | 6104.0 | 5540.0 | 6830.0 | 6156.8 | 5800.5 | 7001.4 |
| Age, yr | 80.6 | 11.0 | 325.0 | 102.6 | 19.0 | 374.0 |
| N, ha–1 | 685.8 | 95.5 | 2387.3 | 579.1 | 120.0 | 2560.0 |
| BA, m2 ha–1 | 21.7 | 1.4 | 73.0 | 17.5 | 1.8 | 113.2 |
| DG, cm | 23.6 | 15.0 | 93.7 | 23.3 | 15.0 | 71.2 |
| BApine, m2 ha–1 | 9.2 | 0.0 | 60.1 | 6.3 | 0.0 | 57.2 |
| BAspruce, m2 ha–1 | 9.1 | 0.0 | 73.0 | 7.4 | 0.0 | 113.2 |
| BAbrd, m2 ha–1 | 3.4 | 0.0 | 60.6 | 3.8 | 0.0 | 53.4 |
| BApineRel | 0.5 | 0.0 | 1.0 | 0.4 | 0.0 | 1.0 |
| BAbrdRel | 0.2 | 0.0 | 1.0 | 0.3 | 0.0 | 1.0 |
| N_dead, ha–1 | 13.5 | 0.0 | 954.9 | 17.2 | 0.0 | 680.0 |
| BA_dead, m2 ha–1 | 0.376 | 0.0 | 44.3 | 0.391 | 0.0 | 25.8 |
| DG_dead, cm | 17.8 | 10.0 | 75.8 | 16.4 | 10.0 | 58.9 |
| mortality, {0, 1} | 0.3 | 0.0 | 1.0 | 0.3 | 0.0 | 1.0 |
| Table 3. Description of sub data, which contained mortality at the following period, for modelling the amount of mortality. | ||||||
| Data set | SWEDEN (n = 4218) | NORWAY (n = 3107) | ||||
| Variable | mean | min | max | mean | min | max |
| DDY, d.d. | 1141.2 | 426.8 | 1732.9 | 890.4 | 303.5 | 1873.1 |
| Altitude, m | 226.8 | 0.0 | 761.0 | 354.1 | 2.0 | 1015.0 |
| Slope, % | 5.0 | 0.0 | 33.1 | 28.8 | 0.0 | 130.0 |
| Latitude, min | 6096.2 | 5540.0 | 6800.0 | 6172.1 | 5800.5 | 7001.4 |
| Age, yr | 84.1 | 11.0 | 325.0 | 100.5 | 19.0 | 318.0 |
| N, ha–1 | 826.4 | 95.5 | 2387.3 | 748.9 | 120.0 | 2560.0 |
| BA, m2 ha–1 | 25.2 | 2.1 | 61.9 | 22.2 | 1.8 | 113.2 |
| DG, cm | 23.3 | 15.0 | 71.0 | 23.1 | 15.0 | 56.6 |
| BApine, m2 ha–1 | 9.1 | 0.0 | 51.1 | 5.0 | 0.0 | 54.6 |
| BAspruce, m2 ha–1 | 11.4 | 0.0 | 58.6 | 10.8 | 0.0 | 113.2 |
| BAbrd, m2 ha–1 | 4.7 | 0.0 | 54.9 | 6.3 | 0.0 | 53.4 |
| BApineRel | 0.38 | 0.00 | 1.00 | 0.24 | 0.00 | 1.00 |
| BAbrdRel | 0.20 | 0.00 | 1.00 | 0.36 | 0.00 | 1.00 |
| N_dead, ha–1 | 52.7 | 31.8 | 954.9 | 65.1 | 40.0 | 680.0 |
| BA_dead, m2 ha–1 | 1.5 | 0.3 | 44.3 | 1.5 | 0.3 | 25.8 |
| DG_dead, cm | 17.8 | 10.0 | 75.8 | 16.4 | 10.0 | 58.9 |
| BArelMort | 0.062 | 0.050 | 0.986 | 0.083 | 0.050 | 0.970 |
| Table 4. Description of the model application data, which contained 57 unmanaged spruce-dominated plots in Finland (see Peltoniemi and Mäkipää 2011). | ||||||||||
| Plot size m2 | Period yrs | DDY d.d. | Age yrs | BA m2 ha–1 | N ha–1 | DQ cm | DG cm | N_dead ha–1 | BA_dead m2 ha–1 | |
| mean | 1585.5 | 10.9 | 1147.8 | 152.1 | 38.9 | 1020.9 | 22.8 | 29.8 | 131.8 | 3.7 |
| stdev | 587.9 | 2.1 | 86.2 | 37.6 | 8.9 | 375.9 | 3.5 | 4.6 | 71.6 | 2.2 |
| min | 750.0 | 7.0 | 928.0 | 80.0 | 18.3 | 340.0 | 14.6 | 20.1 | 8.0 | 0.1 |
| max | 3150.0 | 15.0 | 1411.0 | 290.0 | 65.0 | 1700.0 | 29.7 | 39.9 | 344.4 | 10.4 |
| Table 5. Estimated parameters for the linear part (X'b) for the probability of no mortality occurrence (Model 1). | ||||
| Variable | Estimate | Std Error | t Value | Pr > |t| |
| Intercept | 3.1751 | 0.07359 | 43.15 | <0.0001 |
| Age | –0.00417 | 0.000416 | –10.01 | <0.0001 |
| DQ1.5 | 0.01382 | 0.000556 | 24.86 | <0.0001 |
| √BA | –0.6693 | 0.01557 | –42.99 | <0.0001 |
| BApineRel × Age | 0.004356 | 0.000423 | 10.31 | <0.0001 |
| BAbrdRel × Age | –0.01112 | 0.000622 | –17.88 | <0.0001 |
| Slope/100 | –1.0542 | 0.09451 | –11.15 | <0.0001 |
| WEST | 0.1354 | 0.03443 | 3.93 | <0.0001 |
| TH5 × BA | 0.005803 | 0.001818 | 3.19 | 0.0014 |
| PEAT | –0.2201 | 0.05102 | –4.31 | <0.0001 |
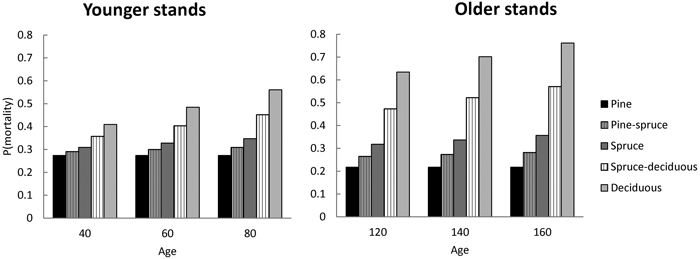
Fig. 1. The predicted probability of mortality during next 5-year period with respect to stand age for stands having different species composition (pure vs 50% mixture). The stand basal area of 23 m2 ha–1, stem number of 970 ha–1 for younger stands and 700 ha–1 for older stands, DQ of 17.4 cm and 20.4 cm, respectively, are reflecting means for the Swedish modelling data group into stands below or above 100 year of stand age.
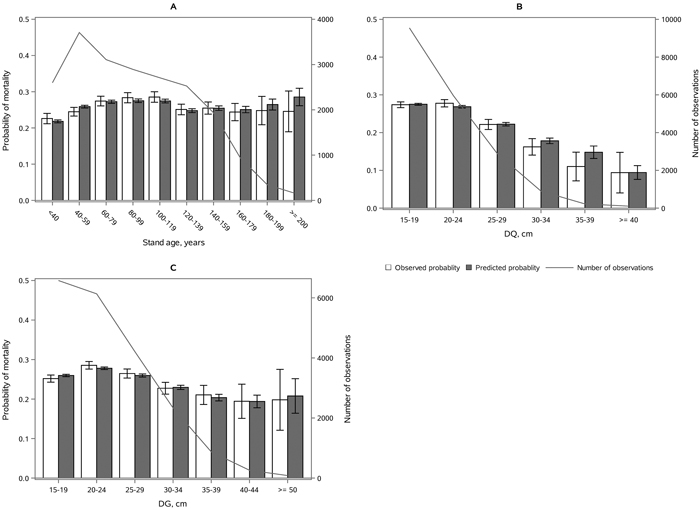
Fig. 2. Observed vs predicted 5-yr probability of mortality (with 95% confidence limits) by classes of A) stand age, B) quadratic mean dbh, DQ and C) basal area weighted mean dbh, DG. The line depicts the number of observations in each class. View larger in new window/tab.
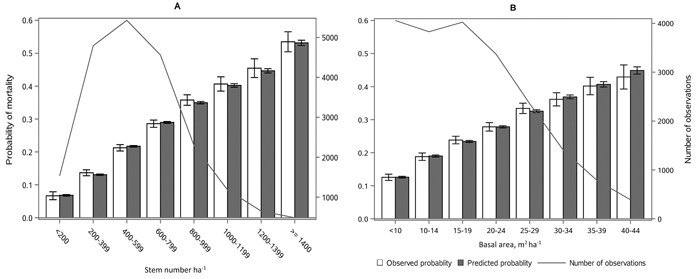
Fig. 3. Observed vs predicted 5-yr probability of mortality (with 95% confidence limits) by classes of A) stem number and B) basal area. The line depicts the number of observations in each class. View larger in new window/tab.
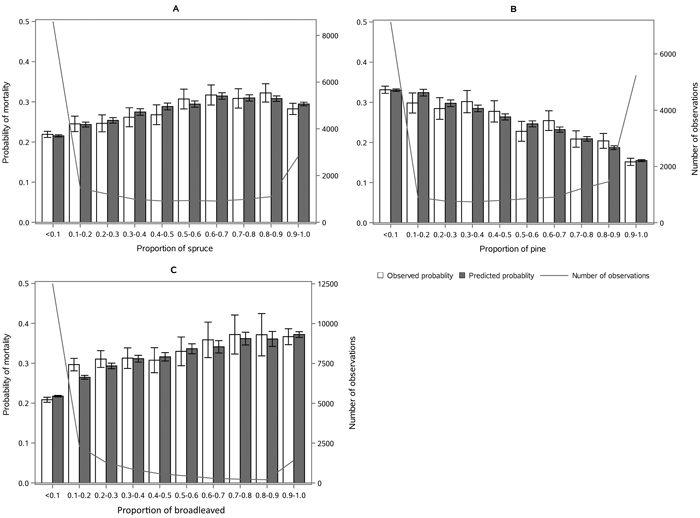
Fig. 4. Observed vs predicted 5-yr probability of mortality (with 95% confidence limits) by classes of A) proportion of spruce, B) proportion of pine and C) proportion of broadleaved species of basal area. The line depicts the number of observations in each class. View larger in new window/tab.
| Table 6. Estimated parameters for the linear part (X'b) for the proportion of basal area in surviving trees (Model 2). | ||||
| Variable | Estimate | Approx | Approximate 95% Confidence | |
| Std Error | Limits | |||
| Intercept | –7.3745 | 0.7404 | –8.8259 | –5.9230 |
| ln(N) | 1.4010 | 0.1356 | 1.1351 | 1.6668 |
| √N | –0.0296 | 0.0131 | –0.0554 | –0.0039 |
| BA | –0.0117 | 0.0037 | –0.0190 | –0.0044 |
| ln(DQ) | 0.5633 | 0.1569 | 0.2556 | 0.8709 |
| BApineRel × ln(Age) | 0.0790 | 0.0100 | 0.0595 | 0.0986 |
| BAbrdRel × ln(Age) | –0.0500 | 0.0105 | –0.0706 | –0.0293 |
| Slope/100 × West | 0.2438 | 0.1212 | 0.0062 | 0.4814 |
| NORWAY | 0.1657 | 0.0304 | 0.1060 | 0.2254 |
| NORWAY: dummy variable for Norwegian NFI data. | ||||
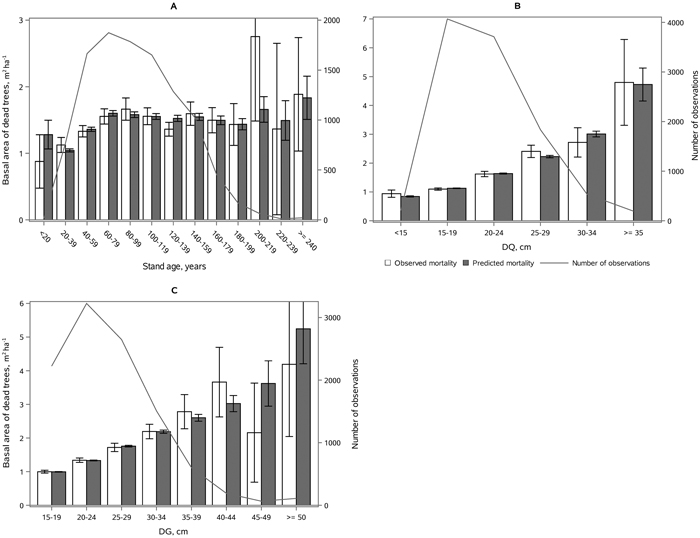
Fig. 5. Mean observed vs mean predicted 5-yr amount of mortality in m2 ha–1 (with 95% confidence limits) by classes of A) age, B) DQ, and C) DG. The line depicts the number of observations in each class. View larger in new window/tab.
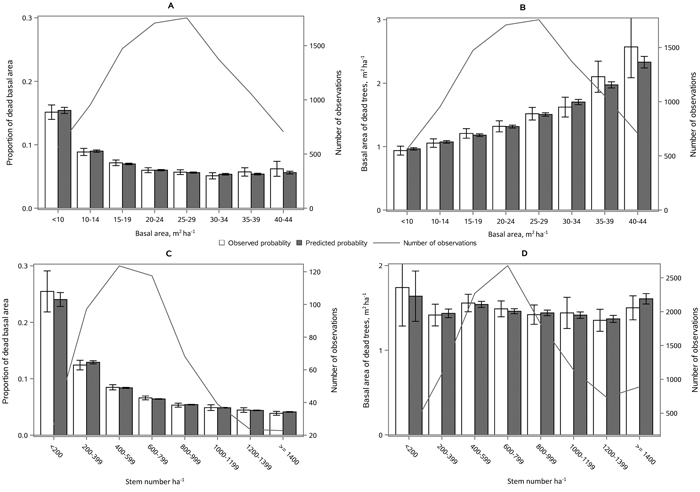
Fig. 6. Mean observed vs mean predicted 5-yr amount of mortality (with 95% confidence limits) as proportion of basal area (Figs. A, C) and absolute basal area of dead trees (Figs. B, D) by classes of stand basal area (Figs. A, B) and stem number (Figs. C, D). The line depicts the number of observations in each class. View larger in new window/tab.
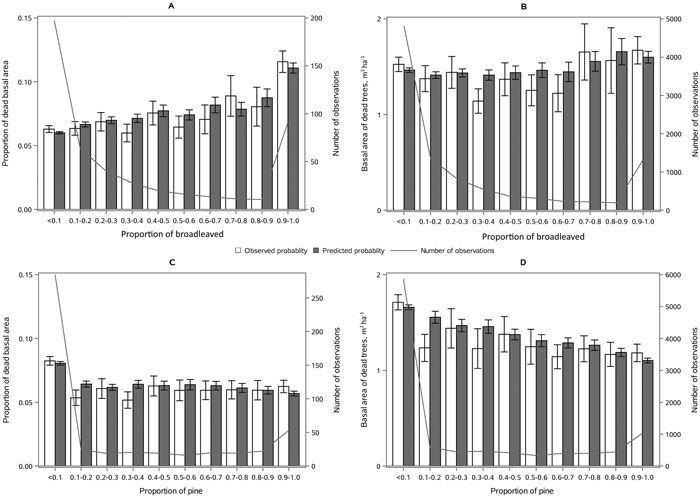
Fig. 7. Mean observed vs mean predicted 5-yr amount of mortality (with 95% confidence limits) as proportion of basal area (A, C) and absolute basal area (B, D) by the proportion of broadleaves (A, B) and proportion of Scots pine (C, D) of stand basal area. The line depicts the number of observations in each class. View larger in new window/tab.
| Table 7. The observed and predicted basal area (BA) of dead trees in the Finnish natural spruce-dominated stands within the observed period length (7–15 yrs) simulated in 5-year steps and the remaining shorter step (e.g. 2-year step when period length was 7 yrs) in Motti. | ||||
| Mean | St. deviation | Minimum | Maximum | |
| Observed BA of dead trees, m2 ha–1 | 3.68 | 2.23 | 0.05 | 10.39 |
| Predicted BA of dead trees, m2 ha–1 | 3.73 | 1.74 | 0.94 | 8.57 |
| Prediction error in the BA of dead trees, m2 ha–1 | –0.051 | 2.48 | –5.25 | 5.68 |
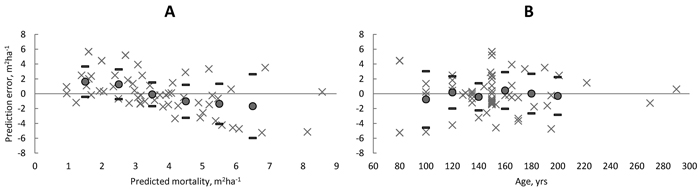
Fig. 8. Prediction errors (× = observed – predicted) in amount of mortality by classes of predicted basal area of dead trees (A) and by classes of stand age (B) in unmanaged spruce dominated stands in Finland. Filled circles showed the average bias within 1-m2 ha–1 basal area and 20-year age classes and thick line showed the ± standard deviation of the prediction error. View larger in new window/tab.