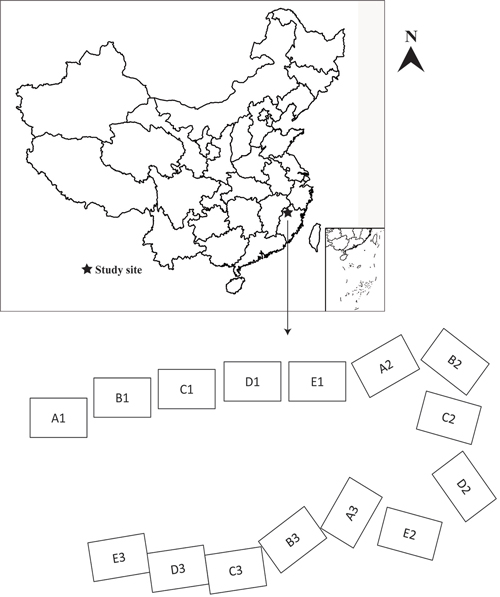
Fig. 1. Plot distributions and location of Chinese fir plantations used for modelling height-diameter allometry.
| Table 1. Statistics of stand-and tree-level variables used for modelling height-diameter allometry of Chinese fir in this study. |
| Planting Density (PD) | BA (m2 ha–1) | N (tree/ha) | HD (m) | DBH (cm) | H (m) |
| Mean | SD | Mean | SD | Mean | SD | Mean | SD | Mean | SD |
| A (1667 trees/ha) | 33.03 | 19.84 | 1588.27 | 193.43 | 14.60 | 6.69 | 15.61 | 7.32 | 12.20 | 6.24 |
| B (3333 trees/ha) | 36.99 | 20.63 | 3094.15 | 513.69 | 13.14 | 6.12 | 12.59 | 5.86 | 10.94 | 5.51 |
| C (5000 trees/ha) | 40.47 | 21.95 | 4415.94 | 976.48 | 13.61 | 6.45 | 12.04 | 5.87 | 11.22 | 5.74 |
| D (6667 trees/ha) | 44.58 | 24.36 | 5705.04 | 1412.55 | 12.77 | 6.28 | 11.21 | 5.36 | 10.66 | 5.34 |
| E (10 000 trees/ha) | 42.21 | 19.97 | 7719.66 | 2794.09 | 12.27 | 5.94 | 9.87 | 5.13 | 9.41 | 4.87 |
| Table 2. Summary statistics of climate variables for the years 1984–2010 used for modelling height-diameter allometry. Values in parentheses are minimum and maximum values. |
| Climate variable | Description | Mean |
| MAT (°C) | Mean annual temperature | 18.96 (18.10, 19.80) |
| MWMT (°C) | Mean warmest month temperature | 28.26 (26.50, 30.30) |
| MCMT (°C) | Mean coldest month temperature | 8.34 (5.20, 10.20) |
| AP (mm) | Annual precipitation | 1795.79 (1390.00, 2416.00) |
| AHM | Annual heat-moisture index | 16.45 (11.90, 21.40) |
| SMMT (°C) | Summer mean maximum temperature | 32.10 (30.30, 33.80) |
| WMMT (°C) | Winter mean minimum temperature | 4.95 (2.50, 6.60) |
| SMT (°C) | Spring (Mar.–May) mean temperature | 18.53 (16.90, 19.60) |
| Table 3. Inference rules for determining if variables have an effect on tree height using the Bayesian model averaging (BMA) posterior probability. |
| Probability | Effect of xj on tree height |
| P(βj ≠ 0 | y) < 0.5 | no effect |
| 0.5 ≤ P(βj ≠ 0 | y) < 0.75 | weak effect |
| 0.75 ≤ P(βj ≠ 0 | y) < 0.95 | positive effect |
| P(βj ≠ 0 | y) ≥ 0.95 | strong effect |
| Table 4. The top five models selected and their posterior probabilities (post prob) of tree height-diameter allometry through Bayesian model averaging (BMA) and the model selected by stepwise approach (SR). The BMA model that has same variables as the SR model is in bold. |
| BMA models | SR Model |
| Models | Post prob | | DBH, PD, HD, BA, MAT, MCMT, SMMT, WMMT |
| Model 1 | (0.454) | DBH, PD, HD, BA, MAT, MCMT, SMMT |
| Model 2 | (0.312) | DBH, PD, HD, BA, MAT, SMMT, WMMT |
| Model 3 | (0.127) | DBH, PD, HD, BA, MAT, MCMT, SMMT, WMMT |
| Model 4 | (0.082) | DBH, PD, HD, BA, MAT, MCMT, AHM, SMMT |
| Model 5 | (0.016) | DBH, PD, HD, BA, MCMT, SMMT |
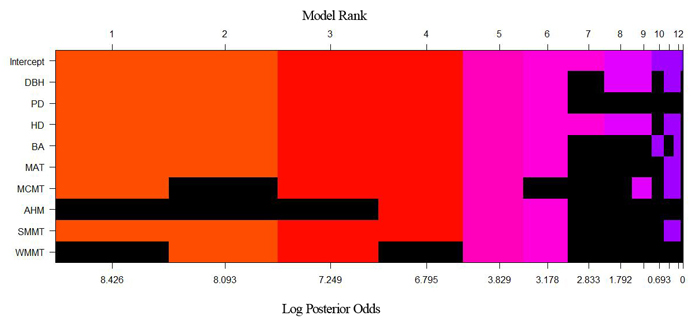
Fig. 2. Height-diameter model space through Bayesian model averaging (BMA). Each column represents one of the candidate models. The variables in black and other colors for each column are excluded and included in a model, respectively. The different colors of each column included in a model were used to help visually contrast differences in model ranking. The width of the column is proportional to the model’s posterior probability on the axis. View larger in new window/tab.
| Table 5. Evaluation statistics of model prediction determined by Bayesian model averaging (BMA) and stepwise (SR) methods for modelling height-diameter allometry. |
| Statistics | BMA | SR |
| R2 | 0.9541 | 0.9540 |
| MD | 0.0018 | –0.0078 |
| MAD | 0.9042 | 0.9043 |
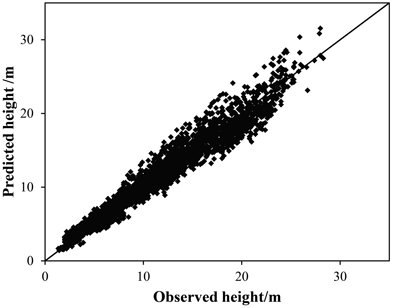
Fig. 3. Relationship between predicted height from Bayesian model averaging (BMA) and observed height based on the validation dataset.
| Table 6. The parameter estimates determined by Bayesian model averaging (BMA) and stepwise (SR) methods for modelling height-diameter allometry. |
| Variable | SR | BMA |
| Mean | 95%CI | P-value | Mean | 95% CI | PP |
| Intercept | 0.599 | –0.177, 1.574 | >0.05 | 2.263 | 2.260, 2.266 | 1.000 |
| DBH | 0.540 | 0.526, 0.664 | <0.01 | 0.540 | 0.527, 0.554 | 1.000 |
| PD | 0.106 | 0.099, 0.114 | <0.01 | 0.106 | 0.099, 0.113 | 0.999 |
| HD | 0.678 | 0.664, 0.695 | <0.01 | 0.678 | 0.661, 0.690 | 0.999 |
| BA | –0.099 | –0.107, –0.091 | <0.01 | –0.099 | –0.107, –0.089 | 1.000 |
| MAT | 0.563 | 0.341, 0.784 | <0.01 | 0.498 | 0.241, 0.648 | 0.991 |
| MCMT | –0.059 | –0.099, –0.018 | <0.01 | –0.056 | –0.123, –0.055 | 0.714 |
| AHM | - | - | >0.05 | 0.002 | 0.000, 0.032 | 0.098 |
| SMMT | –0.989 | –1.250, –0.728 | <0.01 | –0.974 | –1.275, –0.670 | 1.000 |
| WMMT | –0.037 | –0.064, –0.010 | <0.01 | –0.024 | –0.070, 0.000 | 0.413 |
| Table 7. Summary of the scale of height-diameter allometry. |
| Scale | Study by Mcmahon and Kronauer (1976) | Study by Zhang et al. (2019) | This study |
| Stress similarity | Elastic similarity | Geometric similarity |
| 0.50 | 0.66 | 1.00 | Close to 0.5 | 0.54 |