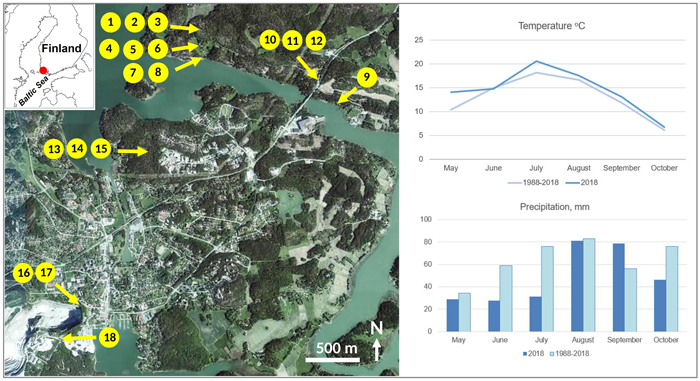
Fig. 1. Locations of the sampling points in the study area on an orthoimage showing the overall landscape structure (source: https://kartta.paikkatietoikkuna.fi/). Forests are dark green, open fields light green, and the residential areas are pale. The white area in the lower left corner is the limestone quarry. The right panel shows climatic data from the weather station Yltöinen (Kaarina) of the Finnish Meteorological Institute ca. 20 km from the study area (Source: https://www.ilmatieteenlaitos.fi/havaintojen-lataus#!/). View larger in new window/tab.
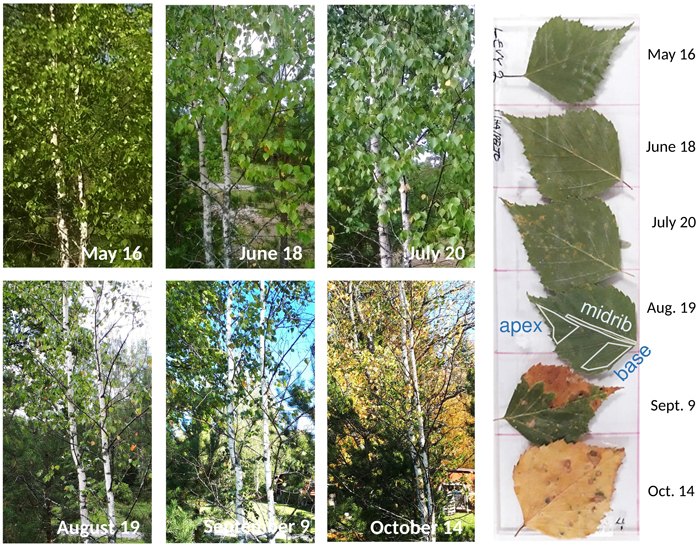
Fig. 2. Seasonal development of a sampled silver birch (tree number 4) in the rural habitat. On the right, consecutive leaf samples of the same tree when attached to a plexiglass plate. On the leaf collected on August 19, locations of the three digitised leaf areas are also shown.
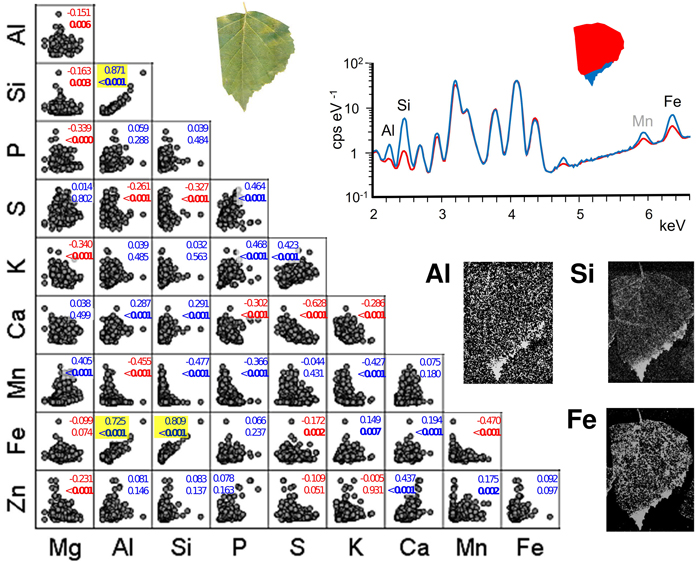
Fig. 3. Pairwise scatter plots with Spearman’s correlation coefficients and p-values (bold: p < 0.05) between different pairs of foliar elements in the sampled silver birch trees. The points represent individual foliar measurements (n = 324, i.e. 6 habitats with 6 monthly collections of 3 leaves having 3 measured leaf parts). Positive correlations are indicated in blue, and negative are in red. Pairs with a strong positive trend (p < 0.001) are highlighted with yellow background. Right: An example leaf (roadmargin tree number 11 in September) in true colour, the XRF spectra for the red and blue leaf areas (selected element peaks are identified with labels), and the element maps of Al, Si and Fe. View larger in new window/tab.
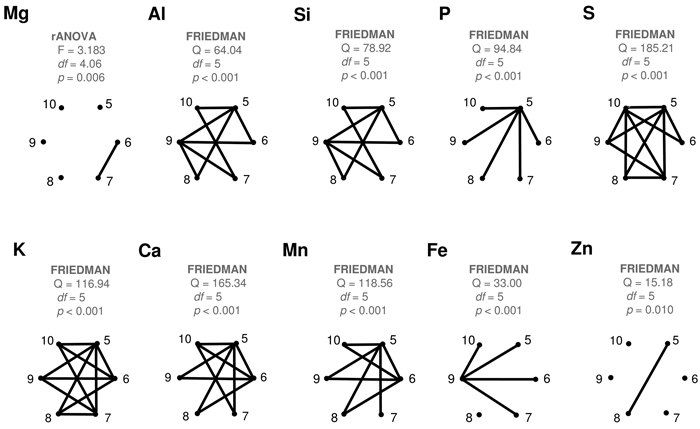
Fig. 4. Results of the statistical comparisons of the monthly contents of different elements in the collected silver birch leaves. Complete graphs show connecting edges between vertices (months) only when their difference is statistically significant (p < 0.05). View larger in new window/tab.
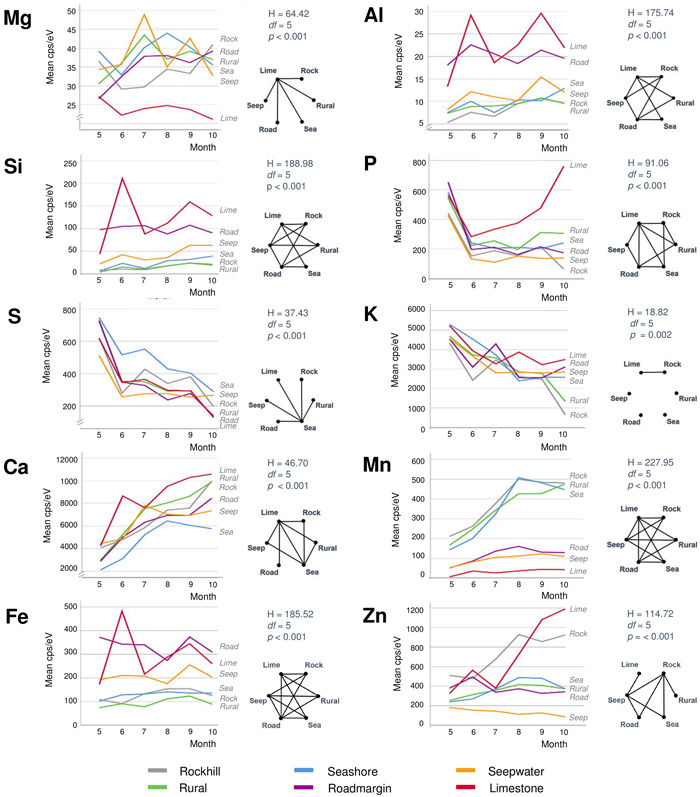
Fig. 5. Monthly average contents of ten different elements of silver birch leaves in six different habitats. The right-hand sides of each element show results from the Kruskal-Wallis tests (above) and pairwise Dunn-Bonferroni comparisons in the form of complete graphs showing connecting edges between vertices (habitats) only when their difference is statistically significant (p < 0.05). View larger in new window/tab.
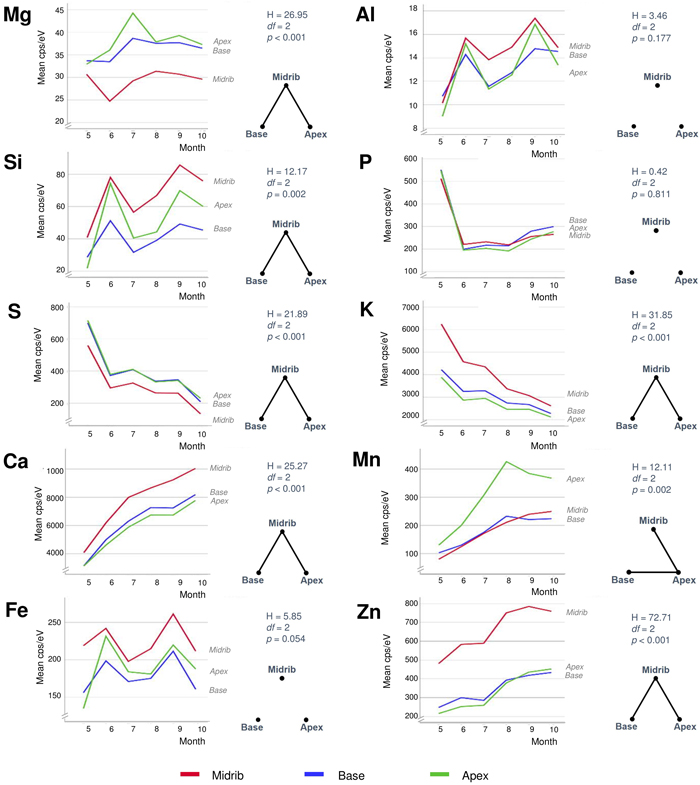
Fig. 6. Monthly average contents of ten different elements of silver birch leaves in three different leaf areas (see Fig. 2). The right-hand sides of each element show results from the Kruskal-Wallis tests (above) and pairwise Dunn-Bonferroni comparisons in the form of complete graphs showing connecting edges between vertices (habitats) only when their difference is statistically significant (p < 0.05). View larger in new window/tab.
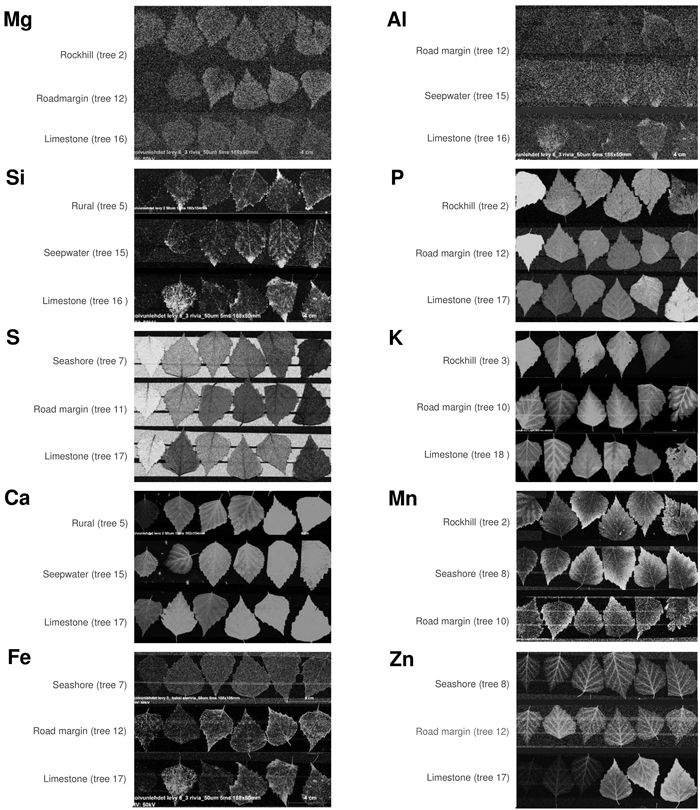
Fig. 7. Element maps by micro-XRF showing monthly collected silver birch leaves from May (left) to October (right). Each of the ten elements contains three time series as a selection of illustrative cases to compare with Figs. 5 and 6. Lighter colors indicate higher values but brightness variations are not linearly related to element contents. View larger in new window/tab.
| Table 1. Summary of the main findings regarding the seasonal, between-habitat and leaf level variations of silver birch leaves for the ten studied elements. | ||||
| Element | Seasonal change | Differences between habitats | Differences between leaf areas | Remarks |
| Mg | Barely any trend | Low in limestone | Low in midrib | Distinct in June |
| Al | Barely any trend | High in limestone and road margin | Elevated in midrib | Correlations with Si and Fe |
| Si | Barely any trend | High in limestone and road margin | High in midrib | Correlations with Al, Fe |
| P | High in May | Late summer increase in limestone | No differences | Decrease from May to June |
| S | Strong decrease | High in seashore | Low in midrib | Low before abscission |
| K | Decrease | Dissimilar contents in October | High in midrib | Variable XRF maps |
| Ca | Strong increase | Limestone the highest, seashore the lowest | High in midrib | Moist habitats exceptional |
| Mn | Local increases | Habitats appear in two groups | High in apex | High contents at leaf margins |
| Fe | Sometimes two peaks | High in road margin and limestone | Possibly elevated in midrib | Correlations with Al and Si |
| Zn | Increase | Late summer high in limestone and rockhill | Very high in midrib | Low levels in seepwater |
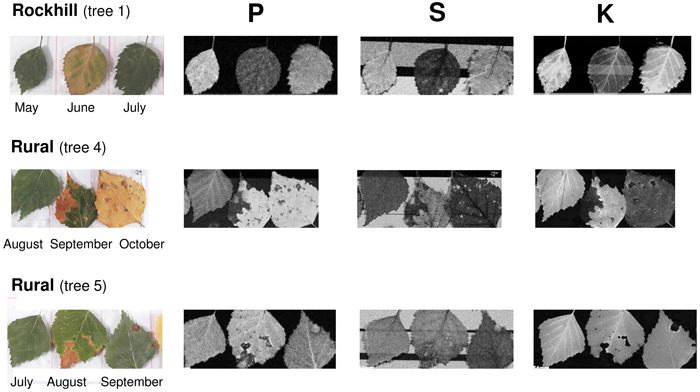
Fig. 8. Partial leaf browning or yellowing in silver birch leaves due to drought-induced problems in three study trees. In the series of three consecutive months, the samples with drought symptoms are in the middle. Lighter colors indicate higher values but brightness variations are not linearly related to element contents. View larger in new window/tab.