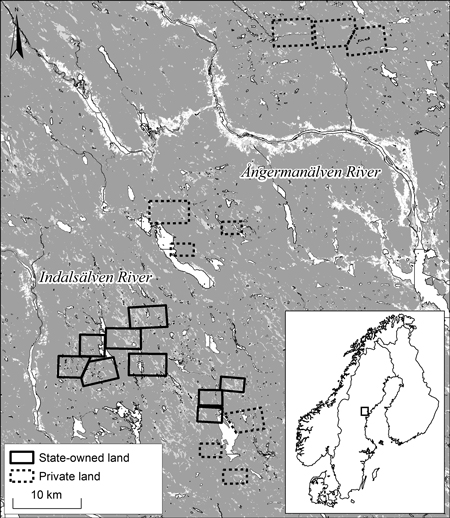
Fig. 1. Map of the study area in Västernorrland province with analyzed landscapes (based on aerial photos from the 1940s) on state-owned land and on private company land, and the distribution of forest (dark gray), open land (light grey) and water (white with black outline). Location in Fennoscandia indicated by a rectangle on the inset map.
| Table 1. Unpublished sources, aerial photos from the 1940s in Västernorrland province, used for data collection. The aerial photos are stored at the archive of the Swedish mapping, cadastral and land registration authority (Swedish: Lantmäteriets arkiv). |
| Lantmäteriet [Swedish mapping, cadastral and land registration authority] |
| Flygfoto 1:20200 Y_44_31_70 1944 [Aerial photography] |
| Flygfoto 1:20200 Y_44_31_71 1944 [Aerial photography] |
| Flygfoto 1:41400 Y_44_32_75 1944 [Aerial photography] |
| Flygfoto 1:41400 Y_44_32_76 1944 [Aerial photography] |
| Flygfoto 1:41400 Y_44_34_69 1944 [Aerial photography] |
| Flygfoto 1:41400 Y_44_34_70 1944 [Aerial photography] |
| Flygfoto 1:41400 Y_44_34_73 1944 [Aerial photography] |
| Flygfoto 1:41400 Y_44_34_74 1944 [Aerial photography] |
| Flygfoto 1:41400 Y_44_34_751944 [Aerial photography] |
| Flygfoto 1:41400 Y_44_34_76 1944 [Aerial photography] |
| Flygfoto 1:41600 Y_44_36_08 1944 [Aerial photography] |
| Flygfoto 1:41600 Y_44_36_09 1944 [Aerial photography] |
| Flygfoto 1:41600 Y_44_36_17 1944 [Aerial photography] |
| Flygfoto 1:41600 Y_44_36_18 1944 [Aerial photography] |
| Flygfoto 1:41600 Y_44_36_32 1944 [Aerial photography] |
| Flygfoto 1:41600 Y_44_36_33 1944 [Aerial photography] |
| Flygfoto 1:20200 Y_44_37_12 1944 [Aerial photography] |
| Flygfoto 1:20200 Y_44_37_13 1944 [Aerial photography] |
| Flygfoto 1:20400 Y_44_45b_16 1944 [Aerial photography] |
| Flygfoto 1:20400 Y_44_45b_17 1944 [Aerial photography] |
| Flygfoto 1:20400 Y_44_47a_20 1944 [Aerial photography] |
| Flygfoto 1:20400 Y_44_47a_21 1944 [Aerial photography] |
| Flygfoto 1:19900 Y_45_25b_08 1945 [Aerial photography] |
| Flygfoto 1:19900 Y_45_25b_09 1945 [Aerial photography] |
| Flygfoto 1:19900 Y_45_41a_48 1945 [Aerial photography] |
| Flygfoto 1:19900 Y_45_41a_49 1945 [Aerial photography] |
| Flygfoto 1:19400 Y_49_141_01 1949 [Aerial photography] |
| Flygfoto 1:19400 Y_49_141_02 1949 [Aerial photography] |
| Flygfoto 1:19400 Y_49_143_04 1949 [Aerial photography] |
| Flygfoto 1:19400 Y_49_143_05 1949 [Aerial photography] |
| Flygfoto 1:19400 Y_49_145_03 1949 [Aerial photography] |
| Flygfoto 1:19400 Y_49_145_04 1949 [Aerial photography] |
| Flygfoto 1:19400 Y_49_147_02 1949 [Aerial photography] |
| Flygfoto 1:19400 Y_49_147_03 1949 [Aerial photography] |
| Flygfoto 1:19400 Y_49_147_05 1949 [Aerial photography] |
| Flygfoto 1:19400 Y_49_147_06 1949 [Aerial photography] |
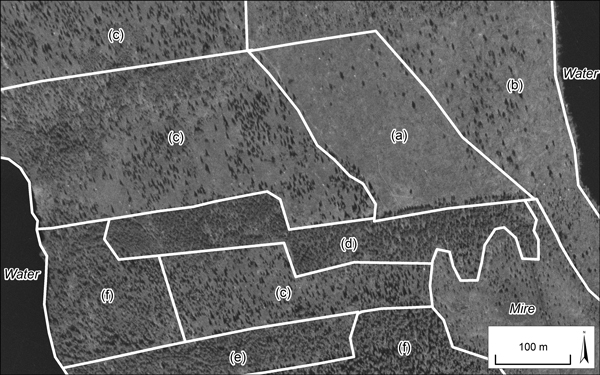
Fig. 2. Examples of each of the six land categories analyzed and identified in this study in an aerial photo from 1949: (a) clear-cut with no trees; (b) clear-cut with seed trees; (c) clear-cut with residual trees; (d) forest 1–25-years-old; (e) forest 26–50-years-old; and (f) forest >50-years-old. Aerial photography 1:19400 Y 49 141 01 1949. Source: Lantmäteriet.
| Table 2. Description of land categories used for delineation of the landscapes into compartments using aerial photos from the 1940s in the Västernorrland province. | |
| Land category | Attributes for aerial photography interpretation |
| Clear-cut with no trees | Clear-cut area > 0.5 ha, with clearly defined borders |
| Clear-cut with seed trees | Clear-cut area > 0.5 ha, with trees of the same height, evenly distributed |
| Clear-cut with residual trees | Clear-cut area > 0.5 ha, with residual trees/group of trees of different height, not evenly distributed |
| Forest 1–25-years-old | Forest with an even stand structure, tree height 0–8 m |
| Forest 26–50-years-old | Forest with an even stand structure, tree height 9–12 m |
| Forest >50-years-old | Forest with an uneven stand structure and trees of different heights (generally >12 m). Includes forest land that does not fit any other land category |
| Mire | Wetlands with or without trees, flat and low terrain, diffuse borders. Includes non-productive forest land |
| Outcrop of bedrock | Bedrock areas with trees or sparse forest, hilly and high terrain, diffuse borders. Includes non-productive forest land |
| Agricultural land | Open, treeless land areas near houses/villages, with clearly defined borders |
| Water | Lakes, rivers and creeks |
| Other | Houses, roads |
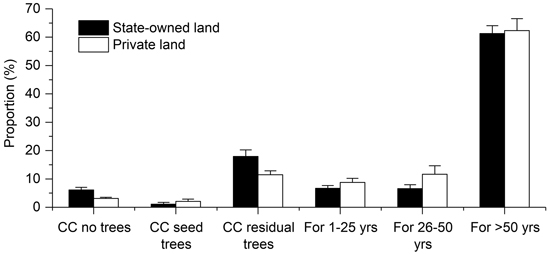
Fig. 3. Proportion of identified and analyzed land categories including clear-cuts (CC) and forests (For) for state-owned land (black bars) and private company land (open bars). Data are presented as means and standard errors.
| Table 3. Comparisons of proportions (%) of identified and analysed land categories on state-owned land and on private company land. Data presented as means and standard errors. Significant differences in bold. | ||||||
| Variable | State-owned land (%) | Private company land (%) | Log transformed | Degrees of freedom | F | p |
| Clear-cut with no trees | 6.1 ± 0.91 | 3.1 ± 0.41 | No | 1, 16 | 9.043 | 0.008 |
| Clear-cut with seed trees | 1.1 ± 0.65 | 2.1 ± 0.76 | No | 1, 16 | 1.036 | 0.324 |
| Clear-cut with residual trees | 17.9 ± 2.31 | 11.5 ± 1.39 | No | 1, 16 | 5.763 | 0.029 |
| Forest 1–25 years | 6.7 ± 0.98 | 8.8 ± 1.45 | No | 1, 16 | 1.451 | 0.246 |
| Forest 26–50 years | 6.6 ± 1.39 | 11.6 ± 2.98 | No | 1, 16 | 2.398 | 0.141 |
| Forest >50 years | 61.3 ± 2.79 | 62.4 ± 4.19 | No | 1, 16 | 0.047 | 0.831 |
| Table 4. Comparisons of minimum, maximum and mean size of compartments (ha) on identified and analysed land categories between state-owned land and on private company land. Data presented as means and standard errors. Significant differences in bold. | ||||||
| Variable | State-owned land (ha) | Private company land (ha) | Log transformed | Degrees of freedom | F | p |
| Minimum size | ||||||
| Clear-cut with no trees | 0.2 ± 0.04 | 0.2 ± 0.06 | No | 1, 16 | 0.090 | 0.768 |
| Clear-cut with seed trees | 2.8 ± 0.45 | 6.4 ± 1.64 | No | 1, 7 | 1.513 | 0.258 |
| Clear-cut with residual trees | 0.4 ± 0.18 | 0.3 ± 0.09 | No | 1, 16 | 0.527 | 0.478 |
| Forest 1–25 years | 0.2 ± 0.04 | 0.3 ± 0.06 | No | 1, 16 | 1.561 | 0.229 |
| Forest 26–50 years | 1.5 ± 0.55 | 0.9 ± 0.23 | No | 1, 16 | 1.068 | 0.317 |
| Forest >50 years | 0.3 ± 0.07 | 0.5 ± 0.21 | No | 1, 16 | 0.574 | 0.460 |
| Maximum size | ||||||
| Clear-cut with no trees | 14.2 ± 2.97 | 9.8 ± 2.24 | No | 1, 16 | 1.347 | 0.263 |
| Clear-cut with seed trees | 16.9 ± 4.40 | 11.8 ± 1.88 | No | 1, 7 | 0.732 | 0.420 |
| Clear-cut with residual trees | 21.4 ± 5.17 | 23.4 ± 4.76 | No | 1, 16 | 0.082 | 0.778 |
| Forest 1–25 years | 13.2 ± 3.32 | 15.1 ± 3.36 | No | 1, 16 | 0.170 | 0.686 |
| Forest 26–50 years | 21.9 ± 5.44 | 24.2 ± 3.83 | No | 1, 16 | 0.123 | 0.730 |
| Forest >50 years | 66.4 ± 10.28 | 86.9 ± 14.78 | No | 1, 16 | 1.297 | 0.263 |
| Mean size | ||||||
| Clear-cut with no trees | 3.3 ± 0.63 | 1.7 ± 0.28 | No | 1, 16 | 4.796 | 0.044 |
| Clear-cut with seed trees | 6.8 ± 2.01 | 9.0 ± 1.43 | No | 1, 8 | 0.445 | 0.523 |
| Clear-cut with residual trees | 4.8 ± 0.63 | 3.9 ± 0.60 | No | 1, 16 | 1.096 | 0.311 |
| Forest 1–25 years | 2.6 ± 0.46 | 3.0 ± 0.34 | No | 1, 16 | 0.485 | 0.496 |
| Forest 26–50 years | 5.0 ± 1.20 | 5.3 ± 0.73 | No | 1, 16 | 0.056 | 0.816 |
| Forest >50 years | 5.9 ± 0.82 | 7.2 ± 1.09 | No | 1, 16 | 0.870 | 0.365 |
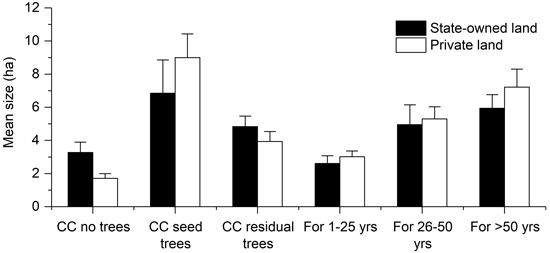
Fig. 4. Mean size (ha) of compartments representing identified and analyzed land categories including clear-cuts (CC) and forests (For) on state-owned land (black bars) and private company land (open bars). Data are presented as means and standard errors.