| Table 1. Stand characteristics at each site before biomass harvest at the start of the experiment in 2007. Numbers inside parentheses are standard deviations. QMD = quadratic mean diameter. | |||||
| Site | Species | Stem density (ha–1) | QMD (cm) | Dominant Height (m) | Basal area (m2 ha–1) |
| A | Norway spruce | 2473 (530) | 3.9 (0.6) | 7.3 (1.0) | 2.9 (0.6) |
| Birch | 11 425 (4106) | 5.2 (0.8) | 13.8 (0.7) | 22.9 (1.0) | |
| Other broadleaves | 1040 (589) | 3.7 (1.6) | - | 1.1 (0.9) | |
| B | Norway spruce | 3158 (1251) | 3.5 (1.0) | 7.5 (2.0) | 2.9 (1.4) |
| Birch | 10 642 (1023) | 5.7 (0.4) | 14.8 (0.7) | 27.1 (2.7) | |
| Other broadleaves | 1308 (1154) | 2.3 (1.4) | - | 0.8 (1.3) | |
| Table 2. Stem density and quadratic mean diameter (QMD) after the establishment of the experiment in 2007. The management strategies are a non-thinned control (CTR), biomass harvest and thinning to promote pure stands of Norway spruce (Picea abies) (NS) and birch (Betula pendula) (BI) or a mixture of Norway spruce and birch (MIX). | ||||||||
| Site | Treatment | Stems ha–1 | QMD (cm) | |||||
| Spruce | Birch | Other broad-leaves | Spruce | Birch | Basal area (m2 ha–1) | Volume (m3 ha–1) | ||
| A | CTR | 2117 | 9842 | 842 | 4.0 | 5.4 | 26.9 | 134.4 |
| NS | 1208 | 0 | 0 | 4.7 | - | 2.1 | 7.1 | |
| BI | 0 | 1167 | 0 | - | 9.9 | 9.0 | 52.7 | |
| MIX | 1267 | 1200 | 0 | 4.4 | 10.4 | 12.1 | 69.4 | |
| B | CTR | 2983 | 11 300 | 1172 | 2.9 | 5.7 | 30.6 | 174.7 |
| NS | 1406 | 0 | 0 | 4.2 | - | 2.0 | 6.3 | |
| BI | 0 | 1161 | 0 | - | 10.5 | 10.0 | 64.4 | |
| MIX | 1400 | 1183 | 17 | 3.3 | 10.5 | 11.5 | 70.6 | |
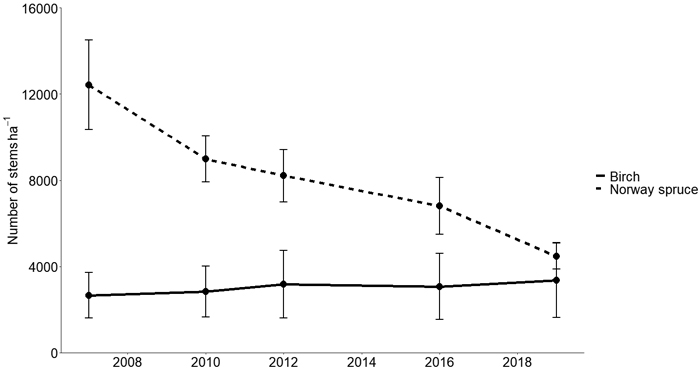
Fig. 1. Average stem density of birch and Norway spruce (Picea abies) (stems hectare–1) in unmanaged control (CTR) plots. Error bars show standard deviations.
| Table 3. Analysis of variance (type II Wald χ2 test) for total volume production, diameter at breast height for the 300 largest stems ha–1 (DBHdom) by tree species (Picea abies and Betula pendula) and living crown ratio for birch (Betula pendula). QMD = quadratic mean diameter. | |||||
| Response variable | Tree species | Variable | F-value | df | P-value |
| Volume | Strategy | 21.762 | 3 | 1.546e–05 | |
| Initial volume 2006 | 5.083 | 1 | 0.04 | ||
| Site | 3.486 | 1 | 0.083 | ||
| DBHdom | Norway spruce | Strategy | 29.623 | 2 | 6.281e–05 |
| Norway spruce | Initial QMD 2006 | 2.168 | 1 | 0.172 | |
| Norway spruce | Site | 3.227 | 1 | 0.103 | |
| DBHdom | Birch | Strategy | 1.062 | 2 | 0.38 |
| Birch | Initial QMD 2006 | 1.2 | 1 | 0.3 | |
| Birch | Site | 3.74 | 1 | 0.08 | |
| Living crown length | Birch | Strategy | 27.768 | 3 | 4.005e–08 |
| Birch | Tree height | 4.968 | 1 | 0.035 | |
| Birch | Site | 28.351 | 1 | 1.613e–05 | |
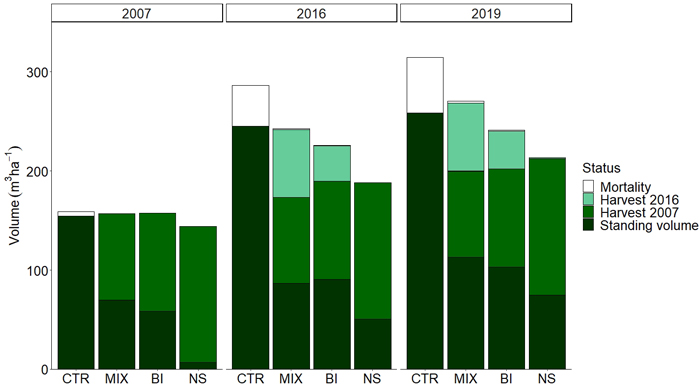
Fig. 2. Total standing stem volume (m3 ha–1), biomass harvest in 2007, birch (Betula pendula) thinning harvest in 2016, and mortality between 2007 and 2019. The management strategies are a non-thinned control (CTR), biomass harvest and thinning to promote pure stands of Norway spruce (Picea abies) (NS), birch (BI) or a mixture of Norway spruce and birch (MIX).
| Table 4. Volume production in each strategy and control, diameter at breast height for the 300 largest stems ha–1 (DBHdom) for Norway spruce (Picea abies) and crown length for birch (Betula pendula) in 2019. Letters in the final column indicate significant differences among strategies using Tukey t-test (within response variables) at p = 0.05. | ||||
| Response variable | Tree species | Strategy | Average total stem volume production (m3 ha–1), average DBHdom (cm), average crown length (m) | Significance |
| Volume | CTR | 315 | a | |
| MIX | 269 | b | ||
| BI | 239 | b | ||
| NS | 222 | c | ||
| DBHdom | Norway spruce | CTR | 9.8 | a |
| Norway spruce | MIX | 12.6 | b | |
| Norway spruce | NS | 16.9 | c | |
| Living crown length | Birch | CTR | 6.08 | a |
| Birch | MIX | 8.45 | b | |
| Birch | BI | 8.65 | b | |
| Table 5. Average stem diameter at breast height for the 300 largest stems ha–1 (DBHdom), quadratic mean diameter (QMD), total stem volume production and basal area for all stems, and average living crown ratio for the sample trees of birch (Betula pendula) and Norway spruce (Picea abies) in the different management strategies at the latest measurement in 2019. Numbers inside parentheses are standard deviations. The management strategies were a non-thinned control (CTR), biomass harvest and thinning to promote pure stands of Norway spruce (NS), birch (BI) or a mixture of Norway spruce and birch (MIX). | ||||||
| Birch | Norway spruce | |||||
| BI | MIX | CTR | NS | MIX | CTR | |
| DBHdom (cm) | 18.7 (0.7) | 18.1 (0.8) | 17.4 (0.9) | 16.9 (2) | 12.6 (1.5) | 9.8 (0.6) |
| QMD (cm) | 16.1 (0.7) | 17.4 (0.6) | 9.5 (0.7) | 12.4 (1.5) | 9.2 (1) | 5.6 (1.2) |
| Total stem volume production (m3 ha–1) | 239 (11) | 139 (20) | 257 (93) | 222 (10) | 39 (10) | 33 (8) |
| Basal area (m2 ha–1) | 14.4 (0.4) | 9.4 (0.8) | 31.4 (2) | 15.3 (1.8) | 8.8 (1.3) | 8.1 (1.4) |
| Living crown ratio (%) | 57 (5) | 53 (5) | 42 (3) | 90 (1) | 89 (2) | 79 (1) |
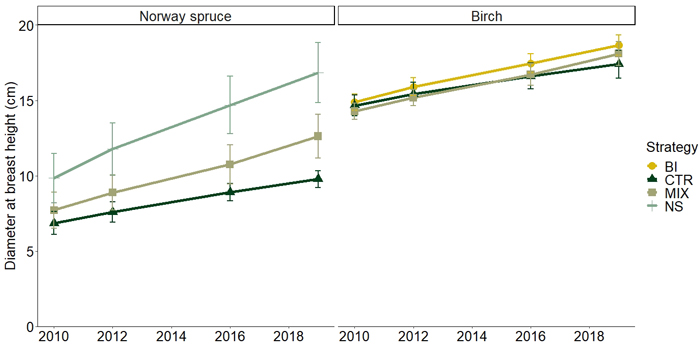
Fig. 3. Average diameter at breast height (cm) for the initially largest crop trees (DBHdom) of Norway spruce (Picea abies) and birch (Betula pendula) (300 stems hectare–1) between 2010 and 2019 for the different management strategies. The management strategies are a non-thinned control (CTR), and biomass harvest and thinning to promote pure stands of Norway spruce (NS), birch (BI) or a mixture of Norway spruce and birch (MIX). Error bars show standard deviations.
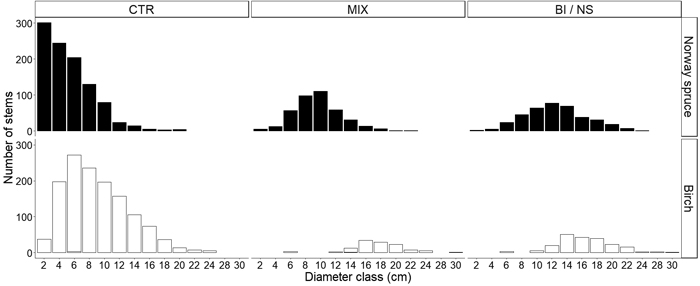
Fig. 4. Diameter distribution for Norway spruce (Picea abies) and birch (Betula pendula) in the different management strategies at the latest measurement in 2019. The management strategies included a non-thinned control (CTR), and biomass harvest and thinning to promote pure stands of Norway spruce (NS), birch (BI) or a mixture of Norway spruce and birch (MIX).
| Table 6. Simulated results of average annual stem volume production (MAI, m3 ha–1 yr–1), net revenue (€ ha–1 yr–1) and harvested assortments: Bio = Biomass (ton DW ha–1 yr–1); Pulp = pulpwood (m3 ha–1 yr–1); Tim = timber (m3 ha–1 yr–1) for sites A and B. R = rotation length (yr). Mortality before the first measurement of CTR, BI, NS and MIX in 2007 was unknown and was not included in MAI. Biofuel prices were BioLow = 14 € and BioHigh = 42 € Mg–1 DW and for birch timber BirchLow = 42 € and BirchHigh = 57 € m–3. The management strategies were a non-thinned control (CTR), biomass harvest and thinning to promote pure stands of Norway spruce (Picea abies) (NS), birch (Betula pendula) (BI) or a mixture of Norway spruce and birch (MIX) and a simulated reference of planted Norway spruce with conventional thinning for roundwood production (PL). | |||||||||||||
| Strategy | Interest rate (%) | BioLow_BirchLow | Assortment | BioHigh_BirchHigh | Assortment | ||||||||
| R | MAI | Net | Bio | Pulp | Tim | R | MAI | Net | Bio | Pulp | Tim | ||
| CTR | 1 | 65 | 8.9 | 1029 | 0.0 | 4.4 | 0.9 | 65 | 8.9 | 1029 | 0.0 | 4.4 | 0.9 |
| BI | 65 | 5.6 | 505 | 0.8 | 2.7 | 0.6 | 70 | 5.6 | 770 | 0.7 | 2.8 | 0.6 | |
| MIX | 97 | 7.3 | 1078 | 0.4 | 3.3 | 1.8 | 105 | 7.3 | 1257 | 0.4 | 3.2 | 1.9 | |
| NS | 107 | 6.9 | 1200 | 0.7 | 1.1 | 3.1 | 110 | 6.9 | 1430 | 0.7 | 1.1 | 3.1 | |
| PL | 93 | 8.3 | 1806 | 0.0 | 2.2 | 4.1 | 93 | 8.3 | 1806 | 0.0 | 2.2 | 4.1 | |
| CTR | 2 | 65 | 8.9 | 1029 | 0.0 | 4.4 | 0.9 | 65 | 8.9 | 1029 | 0.0 | 4.4 | 0.9 |
| BI | 65 | 5.6 | 505 | 0.8 | 2.7 | 0.6 | 65 | 5.6 | 748 | 0.8 | 2.7 | 0.6 | |
| MIX | 85 | 7.3 | 948 | 0.5 | 3.5 | 1.5 | 87 | 7.3 | 1136 | 0.5 | 3.5 | 1.6 | |
| NS | 95 | 6.9 | 1065 | 0.8 | 1.2 | 2.9 | 97 | 6.9 | 1340 | 0.8 | 1.2 | 3.0 | |
| PL | 85 | 8.2 | 1729 | 0.0 | 2.4 | 4.0 | 85 | 8.2 | 1729 | 0.0 | 2.4 | 4.0 | |
| CTR | 3 | 65 | 8.9 | 1029 | 0.0 | 4.4 | 0.9 | 65 | 8.9 | 1029 | 0.0 | 4.4 | 0.9 |
| BI | 65 | 5.6 | 505 | 0.8 | 2.7 | 0.6 | 65 | 5.6 | 748 | 0.8 | 2.7 | 0.6 | |
| MIX | 75 | 7.2 | 799 | 0.6 | 3.6 | 1.2 | 80 | 7.2 | 1053 | 0.5 | 3.6 | 1.4 | |
| NS | 95 | 6.9 | 1065 | 0.8 | 1.2 | 2.9 | 95 | 6.9 | 1312 | 0.8 | 1.2 | 2.9 | |
| PL | 75 | 7.9 | 1509 | 0.0 | 2.5 | 3.7 | 75 | 7.9 | 1509 | 0.0 | 2.5 | 3.7 | |
| CTR | 4 | 65 | 8.9 | 1029 | 0.0 | 4.4 | 0.9 | 65 | 8.9 | 1029 | 0.0 | 4.4 | 0.9 |
| BI | 65 | 5.6 | 505 | 0.8 | 2.7 | 0.6 | 65 | 5.6 | 748 | 0.8 | 2.7 | 0.6 | |
| MIX | 75 | 7.2 | 799 | 0.6 | 3.6 | 1.2 | 75 | 7.2 | 983 | 0.6 | 3.6 | 1.2 | |
| NS | 95 | 6.9 | 1065 | 0.8 | 1.2 | 2.9 | 95 | 6.9 | 1312 | 0.8 | 1.2 | 2.9 | |
| PL | 70 | 7.7 | 1367 | 0.0 | 2.6 | 3.5 | 70 | 7.7 | 1367 | 0.0 | 2.6 | 3.7 | |
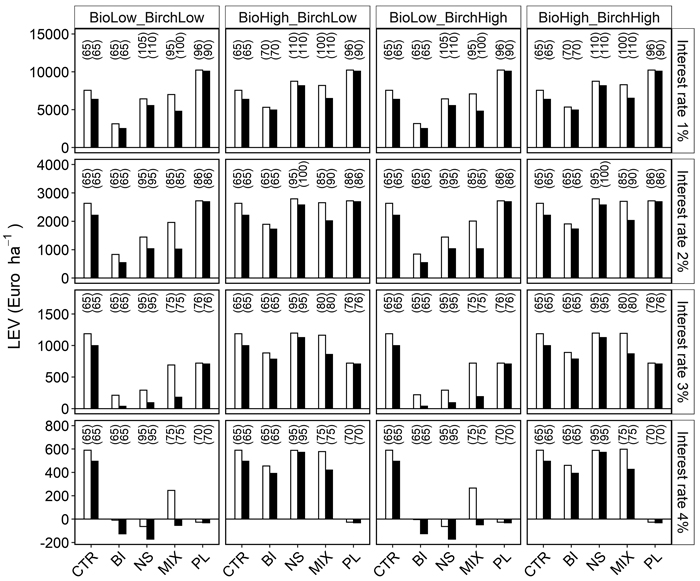
Fig. 5. Simulated land expectation value (LEV) for five management alternatives (x-axis), under four commodity price scenarios (names at the top of the figure) and interest rates between 1 and 4%. Bars show calculated LEV at sites A (unfilled) and B (filled). Biofuel prices were BioLow = 14 € and BioHigh = 42 € Mg–1 DW and birch timber prices BirchLow = 42 € and BirchHigh = 57 € m–3. The management strategies were a non-thinned control (CTR), biomass harvest and thinning to promote pure stands of Norway spruce (Picea abies) (NS), birch (Betula pendula) (BI), a mixture of Norway spruce and birch (MIX) and a simulated reference of planted Norway spruce with conventional thinning for roundwood production (PL). Age at final felling within parentheses.