| Table 1. The mean tree and stand characteristics of the Norway spruce survival modelling datasets, including the Finnish old-growth stands (number of trees, n = 6407), the Finnish thinning experiment (HARKAS, n = 87 331), and the Norwegian experiment (n = 48 738). | |||||||||
| Dataset | Old-growth stands | Finnish experiment | Norwegian experiment | ||||||
| Variable | mean | min | max | mean | min | max | mean | min | max |
| diameter, cm | 21.0 | 4.3 | 76.0 | 17.9 | 0.6 | 52.5 | 10.9 | 0.9 | 46.0 |
| height, m | 18.0 | 3.0 | 34.1 | 17.1 | 1.4 | 35.0 | 10.6 | 1.5 | 33.6 |
| BAL, m2 ha–1 | 27.2 | 0.0 | 51.5 | 19.7 | 0.0 | 58.8 | 23.8 | 0.0 | 64.7 |
| Age, years | 159 | 100 | 290 | 50 | 27 | 88 | 42 | 19 | 148 |
| BA, m2 ha–1 | 38.1 | 18.3 | 51.6 | 32.1 | 9.4 | 58.9 | 35.4 | 8.3 | 64.7 |
| N, stems ha–1 | 959 | 340 | 1694 | 1420 | 188 | 3976 | 4130 | 715 | 9058 |
| DG, cm | 29.1 | 20.1 | 39.6 | 19.5 | 8.9 | 40.3 | 13.3 | 4.7 | 32.7 |
| DQ, cm | 23.0 | 17.7 | 29.7 | 18.3 | 8.0 | 39.3 | 11.5 | 4.1 | 28.3 |
| tree survival | 0.868 | 0 | 1 | 0.964 | 0 | 1 | 0.894 | 0 | 1 |
| period length, yrs | 10.8 | 7 | 15 | 6.1 | 3 | 14 | 5.3 | 3 | 10 |
| No. of periods | 1.0 | 1 | 1 | 3.0 | 1 | 9 | 3.7 | 1 | 12 |
| BAL denotes basal-area-in-larger trees; BA is total stand basal area; N is total stem number; DG is basal area weighted mean diameter; DQ is quadratic mean diameter; tree survival: 1 = surviving, 0 = death. | |||||||||
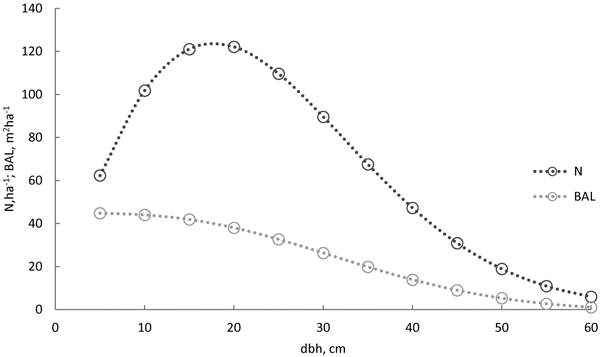
Fig. 1. The diameter distribution for the Norway spruce survival model evaluation was calculated using the model by Siipilehto and Mehtätalo (2013), based on the average characteristics of the old-growth stand (stand basal area 38 m2 ha–1, number of stems 1010 ha–1, basal area weighted mean diameter 30 cm, and age 150 years). Trees (○) were sampled for 5-cm classes, and basal-area-in-larger trees (BAL) was calculated for the sampled trees.
| Table 2. The estimated logistic models for Norway spruce survival without stand age (Eq. 4, Eq. 5). | ||||||
| Eq. 4 | Eq. 5 | |||||
| Variable | estimate | std | t value | estimate | std | t value |
| Intercept | 5.4896 | 0.1413 | 38.8 | 7.1545 | 0.139 | 51.5 |
| 1/d | –2.1721 | 0.2199 | –9.88 | |||
| BAL | –0.09364 | 0.0014 | –66.4 | |||
| BAL/√(d) | –0.2844 | 0.0042 | –67.2 | |||
| d | 0.2693 | 0.0080 | 33.8 | 0.03613 | 0.0075 | 4.84 |
| d2 | –0.00673 | 0.0002 | –36.6 | –0.00206 | 0.0002 | –10.6 |
| Thinn6_10 | 0.3231 | 0.0826 | 3.91 | 0.2927 | 0.0826 | 3.54 |
| Variance | 0.6908 | 0.1173 | 5.89 | 0.7403 | 0.1238 | 5.98 |
| –2 log-likelihood | 39 794 | 39 384 | ||||
| AIC | 39 808 | 39 396 | ||||
| BIC | 39 825 | 39 410 | ||||
| Rank | 5 | 4 | ||||
| d; breast height diameter (cm) of a tree; BAL; basal area (m2 ha–1) of trees larger than the subject tree; Thinn6_10; dummy for thinnings carried out between 6 and 10 years ago (0 = unthinned, 1 = thinned). Rank; the order of fit statistics from the smallest (1 = the best fit) to the highest (5 = the worst fit) for all models. | ||||||
| Table 3. The estimated logistic models for Norway spruce survival with stand age (Eq. 6, Eq. 7, and Eq. 8). | |||||||||
| Eq. 6 | Eq. 7 | Eq. 8 | |||||||
| variable | estimate | std | t value | estimate | std | t value | estimate | std | t value |
| intercept | 7.4445 | 0.1092 | 68.2 | 7.5515 | 0.1121 | 67.4 | 7.327 | 0.146 | 50.2 |
| BAL/√(d) | –0.2856 | 0.0031 | –91.2 | –0.2898 | 0.0032 | –89.1 | –0.294 | 0.0034 | –86.1 |
| d2(Age/100) | –0.00098 | 0.00006 | –16.7 | ||||||
| d1.8(Age/100)0.8 | –0.00234 | 0.0001 | –16.2 | ||||||
| d1.4(Age/100)0.9 | –0.01079 | 0.0007 | –15.5 | ||||||
| Age/100 | 0.4124 | 0.1158 | 3.56 | ||||||
| Thinn6_10 | 0.2812 | 0.0826 | 3.41 | 0.2755 | 0.0826 | 3.34 | 0.2796 | 0.0826 | 3.38 |
| Variance | 0.7543 | 0.1263 | 5.97 | 0.7621 | 0.1275 | 5.98 | 0.7154 | 0.12 | 5.96 |
| –2 log-likelihood | 39 346 | 39 342 | 39 335 | ||||||
| AIC | 39 356 | 39 352 | 39 347 | ||||||
| BIC | 39 368 | 39 364 | 39 362 | ||||||
| Rank | 3 | 2 | 1 | ||||||
| d; breast height diameter (cm) of a tree; BAL; basal area (m2 ha–1) of trees larger than the subject tree; Thinn6_10; dummy for thinnings carried out between 6 and 10 years ago (0 = unthinned, 1 = thinned). Rank; the order of fit statistics from the smallest (1 = the best fit) to the highest (5 = the worst fit) for all models. | |||||||||
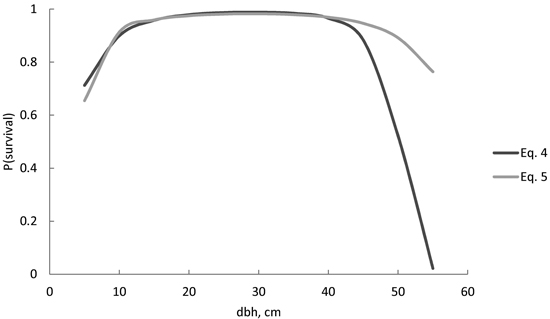
Fig. 2. Predicted Norway spruce survival probability (P) for the following 5-year period, using Eq. 4 and Eq. 5. Neither model included stand age as a predictor variable.
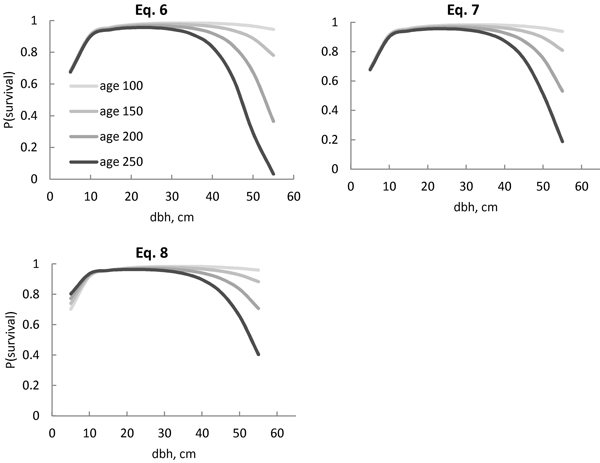
Fig. 3. Predicted Norway spruce survival probability (P) for the following 5-year period with the models (Eqs. 6–8), including interaction between age and stem diameter. The stand age ranged from 100 years (age 100) to 250 years (age 250). Eq. 8 also included stand age per se as a predictor variable, allowing intersecting curves.
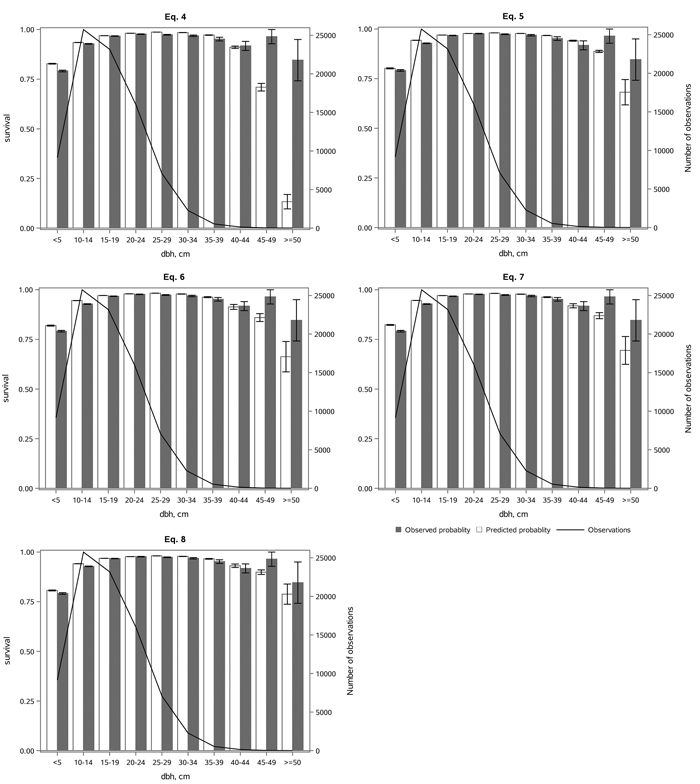
Fig. 4. The observed and predicted Norway spruce survival rate (with standard errors) by diameter classes (dbh), and the number of observations by diameter class, using the alternative models (Eqs. 4–8) in the whole dataset. View larger in new window/tab.
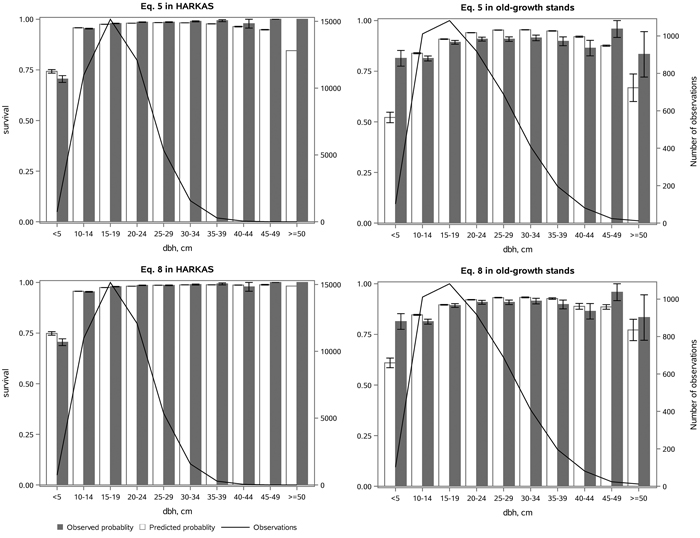
Fig. 5. The observed and predicted Norway spruce survival rate (with standard errors) by diameter class (dbh) estimated with Eq. 5, without stand age, and Eq. 8, which included the effect of age interaction with stem diameter on the tree survival, as well as the number of observations in each diameter class. The subfigures represent the HARKAS dataset, comprising both managed and unmanaged plots, and the old-growth forest stand dataset. View larger in new window/tab.