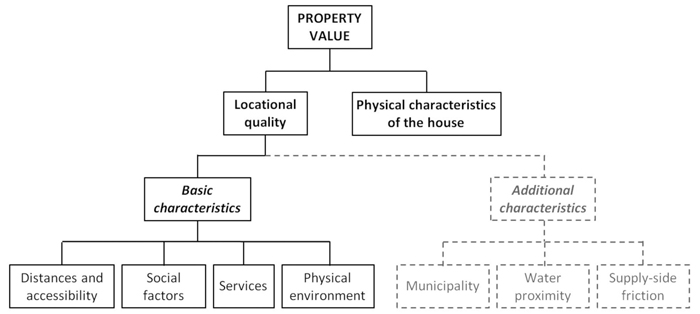
Fig. 1. Analytical framework of this study employed to define the dimensionality of consumer housing value (mod. from Property Value Formation model of Kauko 2004, 2006b) (characteristics excluded from the empirical assessments of this study are illustrated with light grey).
| Table 1. Categories from the analytical framework (bolded) and the survey variables on Statement 14 employed in the empirical analysis on consumer housing value dimensions in Denmark, Finland, Norway, and Sweden. | ||
| PROPERTY VALUE | Survey statements related to the analytical framework on property value formation (the variables excluded in the analysis are in parentheses) | |
| Physical characteristics of the house | “For the house or apartment in itself, indicate the importance of… | |
| 14 C2 | … the amount of natural light indoors” | |
| 14 C3 | … functional floorplan” | |
| 14 C6 | … design and visual appeal of the building (architecture)” | |
| (14 C4 | … newly built”) | |
| (14 C5 | … recently renovated”) | |
| “For environmental and sustainability aspects related to the building you live, indicate the importance of… | ||
| 14 D1 | …the building consists mainly of renewable materials (construction, interior, exterior)” | |
| 14 D2 | …the building has a low carbon footprint in construction” | |
| 14 D3 | …the building has a low carbon footprint in use” | |
| 14 D5 | …recyclability at end-of-lifetime of building” | |
| (14 D4 | …the building is well insulated and use little energy for heating or air-conditioning”) | |
| “For construction and material attributes related to the building you live, indicate the importance of… | ||
| 14 E1 | …solidity and durability” | |
| 14 E2 | …maintenance (frequencies and costs)” | |
| 14 E6 | …materials used in load-bearing construction (non-visible materials)” | |
| 14 E7 | …indoor visible materials (floors, walls and ceilings)” | |
| 14 E8 | …outdoor visible materials (outdoor cladding)” | |
| (14 E3 | …fire safety/vulnerability to fire”) | |
| (14 E4 | …insulation regarding sound”) | |
| (14 E5 | …healthy indoor environment (e.g. air quality)”) | |
| Locational quality Basic characteristics | “For the location and neighborhood of your home, indicate the importance of… | |
| Distances and accessibility | 14 B3 | …short distance to day-care “ |
| 14 B4 | …short distance to schools” | |
| 14 B6 | …short distance to family or friends” | |
| Social factors | 14 B8 | …located in an attractive community with a good reputation“ |
| Services | 14 B2 | …short distance to city center (shops and other services)” |
| 14 B5 | …short distance to leisure facilities (sports parks/training center/pool etc.)” | |
| Physical environment | 14 B1 | …nice view from the area” |
| 14 B7 | …short distance to recreational areas: parks/forests/water” | |
| *14 C1 | …nice view from the house or apartment” | |
| *In the original survey questionnaire this was classified as “Physical attribute of the house”, but since it relates more to the environment than to physical attributes of the house, it was re-categorized into the “Physical environment”. | ||
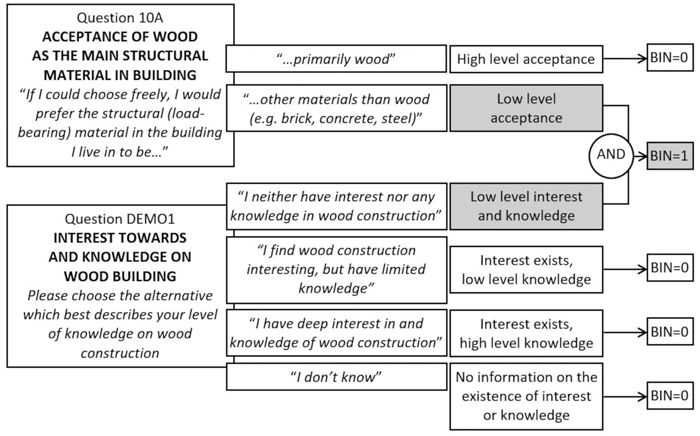
Fig. 2. Procedure of defining respondents with prejudices against the usage of wood as a structural material in building.
| Table 2. Frequencies for responses for each questionnaire statement (percentages in parentheses) for Denmark, Finland, Norway, and Sweden, at levels 1–9 (where 10 stands for “Don’t know”) (n = 2191). The frequencies with highest percentages by statements are bolded. | |||||||||||
| STATEMENT | 1 | 2 | 3 | 4 | 5 | 6 | 7 | 8 | 9 | 10 | |
| 14 C2 | … the amount of natural light indoors” | 25 | 14 | 42 | 96 | 268 | 437 | 576 | 343 | 381 | 9 |
| (1.1) | (0.6) | (1.9) | (4.4) | (12.2) | (19.9) | (26.3) | (15.7) | (17.4) | (0.4) | ||
| 14 C3 | … functional floor plan” | 19 | 7 | 28 | 63 | 175 | 337 | 600 | 439 | 502 | 21 |
| (0.9) | (0.3) | (1.3) | (2.9) | (8.0) | (15.4) | (27.4) | (20.0) | (22.9) | (1.0) | ||
| 14 C6 | … design and visual appeal of the building (architecture)” | 100 | 63 | 163 | 207 | 388 | 455 | 410 | 211 | 181 | 13 |
| (4.6) | (2.9) | (7.4) | (9.4) | (17.7) | (20.8) | (18.7) | (9.6) | (8.3) | (0.6) | ||
| 14 D1 | …the building consists mainly of renewable materials (construction. interior. exterior)” | 141 | 70 | 157 | 207 | 399 | 373 | 323 | 164 | 149 | 208 |
| (6.4) | (3.2) | (7.2) | (9.4) | (18.2) | (17.0) | (14.7) | (7.5) | (6.8) | (9.5) | ||
| 14 D2 | …the building has a low carbon footprint in construction” | 169 | 71 | 142 | 177 | 405 | 334 | 307 | 177 | 146 | 263 |
| (7.7) | (3.2) | (6.5) | (8.1) | (18.5) | (15.2) | (14.0) | (8.1) | (6.7) | (12.0) | ||
| 14 D3 | …the building has a low carbon footprint in use” | 129 | 64 | 128 | 156 | 364 | 349 | 375 | 212 | 216 | 198 |
| (5.9) | (2.9) | (5.8) | (7.1) | (16.6) | (15.9) | (17.1) | (9.7) | (9.9) | (9.0) | ||
| 14 D5 | …recyclability at end-of-lifetime of building” | 209 | 80 | 160 | 170 | 336 | 328 | 315 | 184 | 162 | 247 |
| (9.5) | (3.7) | (7.3) | (7.8) | (15.3) | (15.0) | (14.4) | (8.4) | (7.4) | (11.3) | ||
| 14 E1 | …solidity and durability” | 6 | 4 | 14 | 30 | 135 | 297 | 511 | 506 | 651 | 37 |
| (0.3) | (0.2) | (0.6) | (1.4) | (6.2) | (13.6) | (23.3) | (23.1) | (29.7) | (1.7) | ||
| 14 E2 | …maintenance (frequencies and costs)” | 10 | 5 | 23 | 59 | 221 | 333 | 585 | 434 | 473 | 48 |
| (0.5) | (0.2) | (1.0) | (2.7) | (10.1) | (15.2) | (26.7) | (19.8) | (21.6) | (2.2) | ||
| 14 E6 | …materials used in load-bearing construction (non-visible materials)” | 60 | 32 | 76 | 121 | 333 | 360 | 441 | 292 | 321 | 155 |
| (2.7) | (1.5) | (3.5) | (5.5) | (15.2) | (16.4) | (20.1) | (13.3) | (14.7) | (7.1) | ||
| 14 E7 | …indoor visible materials (floors. walls and ceilings)” | 24 | 11 | 43 | 74 | 266 | 383 | 545 | 429 | 367 | 49 |
| (1.1) | (0.5) | (2.0) | (3.4) | (12.1) | (17.5) | (24.9) | (19.6) | (16.8) | (2.2) | ||
| 14 E8 | …outdoor visible materials (outdoor cladding)” | 64 | 28 | 65 | 130 | 311 | 407 | 509 | 345 | 263 | 69 |
| (2.9) | (1.3) | (3.0) | (5.9) | (14.2) | (18.6) | (23.2) | (15.7) | (12.0) | (3.1) | ||
| 14 B3 | …short distance to day-care “ | 748 | 153 | 152 | 127 | 232 | 208 | 227 | 142 | 162 | 40 |
| (34.1) | (7.0) | (6.9) | (5.8) | (10.6) | (9.5) | (10.4) | (6.5) | (7.4) | (1.8) | ||
| 14 B4 | …short distance to schools” | 663 | 147 | 160 | 141 | 223 | 248 | 272 | 151 | 152 | 34 |
| (30.3) | (6.7) | (7.3) | (6.4) | (10.2) | (11.3) | (12.4) | (6.9) | (6.9) | (1.6) | ||
| 14 B6 | …short distance to family or friends” | 154 | 69 | 201 | 175 | 435 | 365 | 384 | 199 | 196 | 13 |
| (7.0) | (3.1) | (9.2) | (8.0) | (19.9) | (16.7) | (17.5) | (9.1) | (8.9) | (0.6) | ||
| 14 B8 | …located in an attractive community with a good reputation“ | 120 | 51 | 104 | 137 | 326 | 382 | 470 | 297 | 297 | 7 |
| (5.5) | (2.3) | (4.7) | (6.3) | (14.9) | (17.4) | (21.5) | (13.6) | (13.6) | (0.3) | ||
| 14 B2 | …short distance to city center (shops and other services)” | 99 | 60 | 133 | 148 | 296 | 355 | 488 | 298 | 309 | 5 |
| (4.5) | (2.7) | (6.1) | (6.8) | (13.5) | (16.2) | (22.3) | (13.6) | (14.1) | (0.2) | ||
| 14 B5 | …short distance to leisure facilities (sports parks/training center/pool etc.)” | 241 | 119 | 214 | 262 | 396 | 364 | 290 | 151 | 143 | 11 |
| (11.0) | (5.4) | (9.8) | (12.0) | (18.1) | (16.6) | (13.2) | (6.9) | (6.5) | (0.5) | ||
| 14 B1 | …nice view from the area” | 62 | 42 | 111 | 159 | 346 | 377 | 486 | 289 | 311 | 8 |
| (2.8) | (1.9) | (5.1) | (7.3) | (15.8) | (17.2) | (22.2) | (13.2) | (14.2) | (0.4) | ||
| 14 B7 | …short distance to recreational areas: parks/forests/water” | 54 | 25 | 80 | 96 | 263 | 355 | 539 | 331 | 441 | 7 |
| (2.5) | (1.1) | (3.7) | (4.4) | (12.0) | (16.2) | (24.6) | (15.1) | (20.1) | (0.3) | ||
| 14 C1 | …nice view from the house or apartment” | 70 | 45 | 128 | 189 | 359 | 427 | 422 | 286 | 263 | 2 |
| (3.2) | (2.1) | (5.8) | (8.6) | (16.4) | (19.5) | (19.3) | (13.1) | (12.0) | (0.1) | ||
| Table 3. Original variables employed in the final exploratory factor analysis models by countries. | |||||
| Property value | Survey statement | Denmark | Finland | Norway | Sweden |
| Physical characteristics of the house | … the amount of natural light indoors” | X | |||
| … functional floor plan” | X | X | X | X | |
| … design and visual appeal of the building” | X | X | X | ||
| …the building consists mainly of renewable materials” | X | X | X | X | |
| …the building has a low carbon footprint in construction” | X | X | X | X | |
| …the building has a low carbon footprint in use” | X | X | X | X | |
| …recyclability at end-of-lifetime of building” | X | X | X | X | |
| …solidity and durability” | X | X | X | X | |
| …maintenance” | X | X | X | X | |
| …materials used in load-bearing construction” | X | X | X | X | |
| …indoor visible materials” | X | X | X | X | |
| …outdoor visible materials” | X | X | X | X | |
| Locational quality | …short distance to day-care “ | ||||
| …short distance to schools” | |||||
| …short distance to family or friends” | X | ||||
| …located in an attractive community with a good reputation“ | X | X | X | X | |
| …short distance to city center” | X | X | X | X | |
| …short distance to leisure facilities” | X | X | X | X | |
| …nice view from the area” | X | X | X | X | |
| …short distance to recreational areas: parks/forests/water” | X | ||||
| …nice view from the house or apartment” | X | X | X | X | |
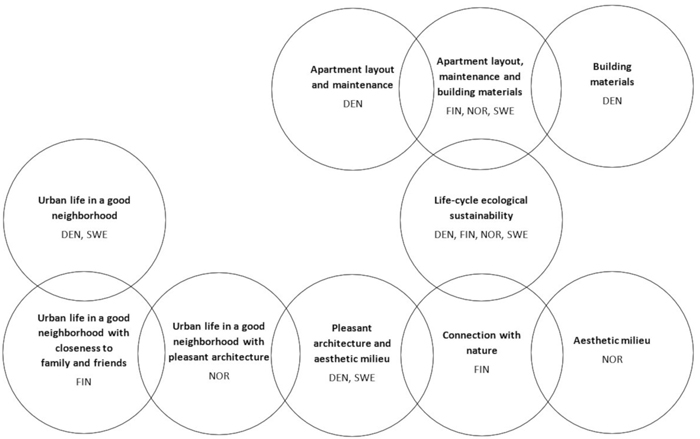
Fig. 3. Simplified illustration of the country-wise exploratory factor solutions for consumer housing value dimensions in Denmark, Finland, Norway and Sweden. View larger in new window/tab.
| Table 4. The number of respondents living in multi-storey houses and other types of houses, and the amount and proportion of prejudiced in both categories. The χ2-test p-value shows the statistical significances in the number of prejudiced between housing types. | ||||
| Country | # of respondents in multi-storey and other types of houses | # of prejudiced in multi-storey and other types of houses | % of prejudiced in multi-storey and other types of houses | χ2-test p-value |
| Denmark | 99/472 | 43/212 | 43%/45% | 0.788 |
| Finland | 198/375 | 55/44 | 39%/13% | 0.000*** |
| Norway | 99/391 | 49/45 | 49%/12% | 0.000*** |
| Sweden | 201/356 | 73/64 | 36%/18% | 0.000*** |
| *suggestive evidence on statistical significance, **moderate evidence on statistical significance, ***very strong evidence on statistical significance. | ||||
| Table 5. Logistic regression model on the linkages between the dimensions of CMVE and prejudices against building with wood among Danish consumers. | ||||||
| Predictor factor | β | SE β | Wald’s χ2 | df | p | eβ |
| Intercept | –0.218 | 0.085 | 6.568 | 1 | 0.010** | 0.804 |
| Apartment layout and maintenance | 0.144 | 0.102 | 1.978 | 1 | 0.160 | 1.155 |
| Building materials | 0.001 | 0.106 | 0.000 | 1 | 0.989 | 1.001 |
| Life-cycle ecological sustainability | –0.126 | 0.092 | 1.865 | 1 | 0.172 | 0.882 |
| Pleasant architecture and aesthetic milieu | –0.224 | 0.090 | 6.145 | 1 | 0.013** | 0.800 |
| Urban life in a good neighborhood | 0.201 | 0.108 | 3.460 | 1 | 0.063* | 1.223 |
| *suggestive evidence on statistical significance, **moderate evidence on statistical significance, ***very strong evidence on statistical significance χ2 = sig. 0.022; Cox & Snell R2 = 0.023; and Nagelkerke R2 = 0.031; Predictive accuracy = 55.3%. | ||||||
| Table 6. Logistic regression model on the linkages between the dimensions of CMVE and prejudices against building with wood among Finnish consumers. | ||||||
| Predictor factor | β | SE β | Wald’s χ2 | df | p | eβ |
| Intercept | –1.731 | 0.127 | 186.494 | 1 | 0.000*** | 0.177 |
| Apartment layout, maintenance and building materials | 0.052 | 0.133 | 0.153 | 1 | 0.696 | 1.053 |
| Life-cycle ecological sustainability | –0.507 | 0.120 | 17.700 | 1 | 0.000*** | 0.602 |
| Connection with nature | –0.350 | 0.129 | 7.339 | 1 | 0.007*** | 0.705 |
| Urban life in a good neighborhood with closeness to family and friends | 0.589 | 0.160 | 12.958 | 1 | 0.000*** | 1.801 |
| *suggestive evidence on statistical significance, **moderate evidence on statistical significance, ***very strong evidence on statistical significance χ2 = sig. 0.000; Cox & Snell R2 = 0.063; and Nagelkerke R2 = 0.105; Predictive accuracy = 82.9%. | ||||||
| Table 7. Logistic regression model on the linkages between the dimensions of CMVE and prejudices against building with wood among Norwegian consumers. | ||||||
| Predictor factor | β | SE β | Wald’s χ2 | df | p | eβ |
| Intercept | –1.468 | 0.118 | 155.614 | 1 | 0.000*** | 0.230 |
| Apartment layout, maintenance and building materials | 0.007 | 0.131 | 0.003 | 1 | 0.959 | 1.007 |
| Life-cycle ecological sustainability | –0.085 | 0.124 | 0.466 | 1 | 0.495 | 0.919 |
| Aesthetic milieu | –0.229 | 0.114 | 4.018 | 1 | 0.045** | 0.796 |
| Urban life in a good neighborhood with pleasant architecture | 0.259 | 0.152 | 4.018 | 1 | 0.089* | 1.295 |
| *suggestive evidence on statistical significance, **moderate evidence on statistical significance, ***very strong evidence on statistical significance χ2 = sig. 0.078; Cox & Snell R2 = 0.015; and Nagelkerke R2 = 0.023; Predictive accuracy = 80.8%. | ||||||
| Table 8. Logistic regression model on the linkages between the dimensions of CMVE and prejudices against building with wood among Swedish consumers. | ||||||
| Predictor factor | β | SE β | Wald’s χ2 | df | p | eβ |
| Intercept | –1.163 | 0.102 | 129.872 | 1 | 0.000*** | 0.313 |
| Apartment layout, maintenance and building materials | 0.069 | 0.113 | 0.370 | 1 | 0.543 | 1.071 |
| Life-cycle ecological sustainability | –0.113 | 0.105 | 1.144 | 1 | 0.285 | 0.893 |
| Pleasant architecture and aesthetic milieu | –0.335 | 0.136 | 5.853 | 1 | 0.002*** | 0.715 |
| Urban life in a good neighborhood | 0.329 | 0.136 | 5.853 | 1 | 0.016** | 1.390 |
| *suggestive evidence on statistical significance, **moderate evidence on statistical significance, ***very strong evidence on statistical significance χ2 = sig. 0.002; Cox & Snell R2 = 0.029; and Nagelkerke R2 = 0.044 Predictive accuracy = 75.9%. | ||||||
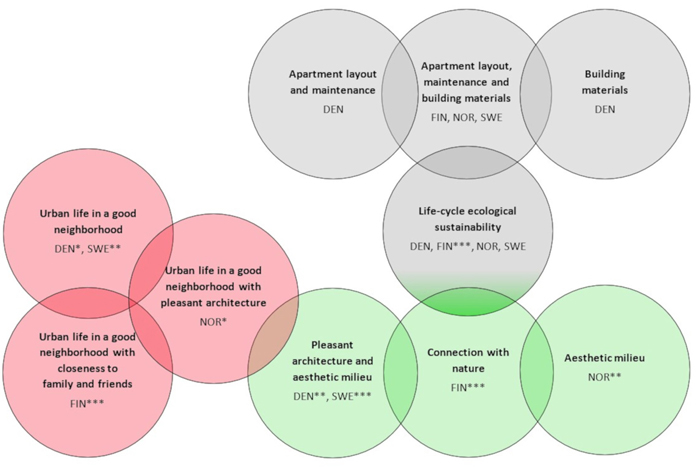
Fig. 4. Simplified illustration of the impacts of consumer housing values on the likelihood of prejudices (red increase, green decrease, grey no evidence against building with wood). For Life-cycle ecological sustainability, only in Finland statistical evidence on the decrease of likelihood for prejudices was received. View larger in new window/tab.