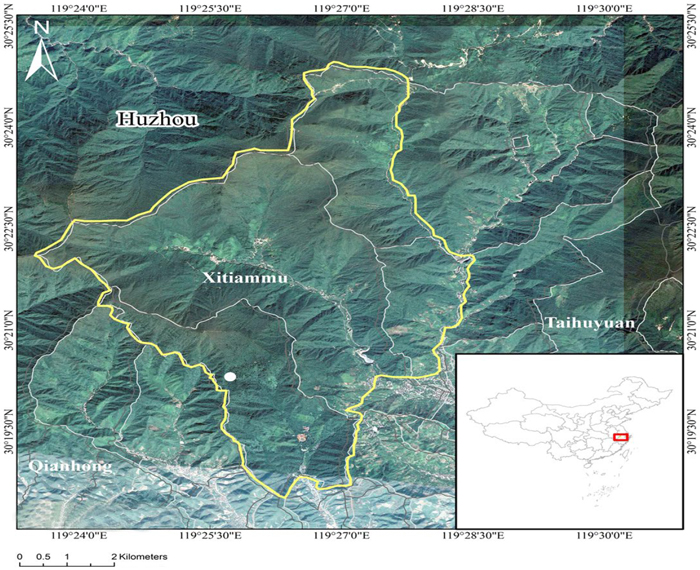
Fig. 1. Location of the study site on Tianmu Mountain in eastern China. Maps were generated using ArcGIS 10.0.
| Table 1. Importance value (%) and abundance of the dominant species (IV ≥ 1%) at different stages in a 1.0 ha (100 m × 100 m) mixed broad-leaved forest plot on Tianmu Mountain, eastern China. | |||||
| Year | Species | Average height (m) | DBH (cm) | Importance value (%) | Abundance |
| 1996 | Cyclobalanopsis myrsinifolia | 8.11 ± 2.04 | 18.49 ± 7.58 | 20.93 | 156 |
| Cyclocarya paliurus | 14.54 ± 5.26 | 26.51 ± 11.46 | 16.53 | 79 | |
| Cunninghamia lanceolata | 11.19 ± 5.53 | 26.07 ± 11.53 | 11.65 | 65 | |
| Liquidambar acalycina | 21.44 ± 6.43 | 40.90 ± 18.74 | 9.42 | 29 | |
| Cryptomeria fortunei | 23.67 ± 13.23 | 92.96 ± 66.59 | 9.09 | 9 | |
| Litsea auriculata | 16.57 ± 3.34 | 33.74 ± 8.99 | 3.21 | 14 | |
| Catalpa ovata | 11.93 ± 4.94 | 23.5 ± 16.78 | 2.78 | 15 | |
| Eurya hebeclados | 6.12 ± 1.14 | 13.80 ± 4.43 | 2.66 | 25 | |
| Lithocarpus harlandii | 6.9 ± 1.08 | 18.74 ± 5.72 | 2.44 | 20 | |
| Daphniphyllum macropodum | 9.92 ± 1.89 | 31.81 ± 7.23 | 2.05 | 12 | |
| Cladrastis wilsonii | 8.18 ± 3.74 | 25.47 ± 7.67 | 1.99 | 11 | |
| Dendrobenthamia japonica | 7 ± 1.03 | 14.08 ± 3.39 | 1.82 | 16 | |
| Pseudolarix amabilis | 24.2 ± 11.97 | 45.01 ± 29.46 | 1.63 | 5 | |
| Cyclobalanopsis multiervis | 8.1 ± 1.52 | 18.38 ± 5.46 | 1.31 | 10 | |
| 2012 | Cyclobalanopsis myrsinifolia | 7.32 ± 2.77 | 17.87 ± 6.30 | 15.12 | 114 |
| Cunninghamia lanceolata | 12.58 ± 5.42 | 27.45 ± 11.61 | 12.21 | 64 | |
| Cyclocarya paliurus | 12.72 ± 5.40 | 31.19 ± 10.59 | 11.91 | 58 | |
| Daphniphyllum macropodum | 6.08 ± 2.88 | 17.87 ± 6.30 | 11.49 | 106 | |
| Liquidambar acalycina | 16.9 ± 4.88 | 42.69 ± 17.48 | 9.67 | 32 | |
| Cryptomeria fortunei | 16.89 ± 11.29 | 78.54 ± 59.25 | 8.05 | 10 | |
| Lithocarpus brevicaudatus | 7.47 ± 4.84 | 23.83 ± 4.66 | 5.57 | 47 | |
| Litsea auriculata | 13.75 ± 4.22 | 40.14 ± 4.10 | 3.43 | 15 | |
| Nyssa sinensis | 11.83 ± 3.50 | 33.98 ± 15.80 | 3.03 | 16 | |
| Dendrobenthamia japonica | 6.03 ± 4.23 | 18.88 ± 3.53 | 2.76 | 26 | |
| Cyclobalanopsis stewardiana | 8.99 ± 1.11 | 25.32 ± 8.44 | 2.05 | 14 | |
| Eurya hebeclados | 4.78 ± 1.62 | 13.23 ± 2.07 | 1.86 | 20 | |
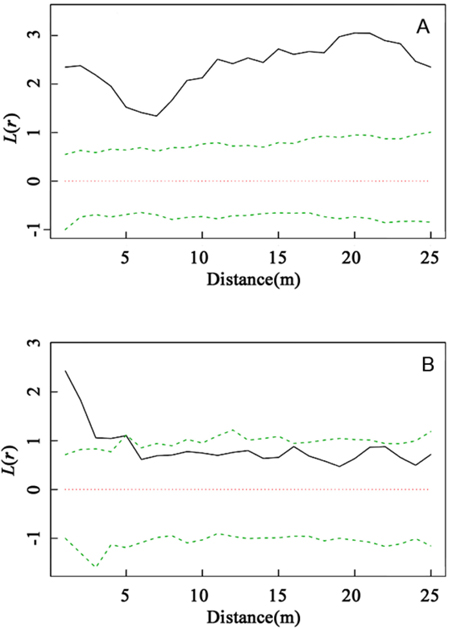
Fig. 2. Intraspecific interaction based on univariate L(r) values for Cyclobalanopsis myrsinifolia in 1996 (A) and C. myrsinifolia in 2012 (B). Univariate L(r) analysis of the spatial pattern of C. myrsinifolia in 1996 (A) and 2012 (B). The solid line shows the actual L(r) value, the green dotted lines show the 99% confidence envelope for the pattern expected from a random distribution of plant localities calculated via Monte Carlo simulations. An L(r) value greater than the confidence interval indicates an aggregated population distribution. An L(r) value less than the confidence interval indicates that the population is uniformly distributed. An L(r) value within the confidence interval indicates the population is randomly distributed.
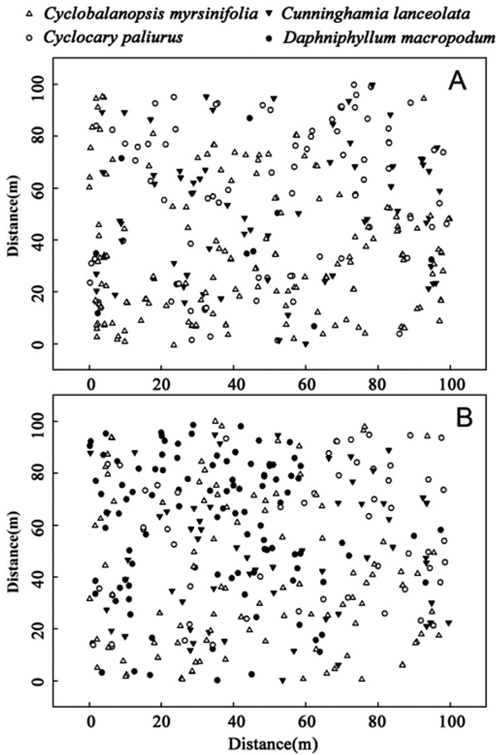
Fig. 3. Spatial distribution of the four main species, Cyclobalanopsis myrsinifolia, Cunninghamia lanceolata, Cyclocarya paliurus and Daphniphyllum macropodum, in 1996 (A) and 2012 (B) in a 1.0 ha (100 m ×100 m) plot on Tianmu Mountain.
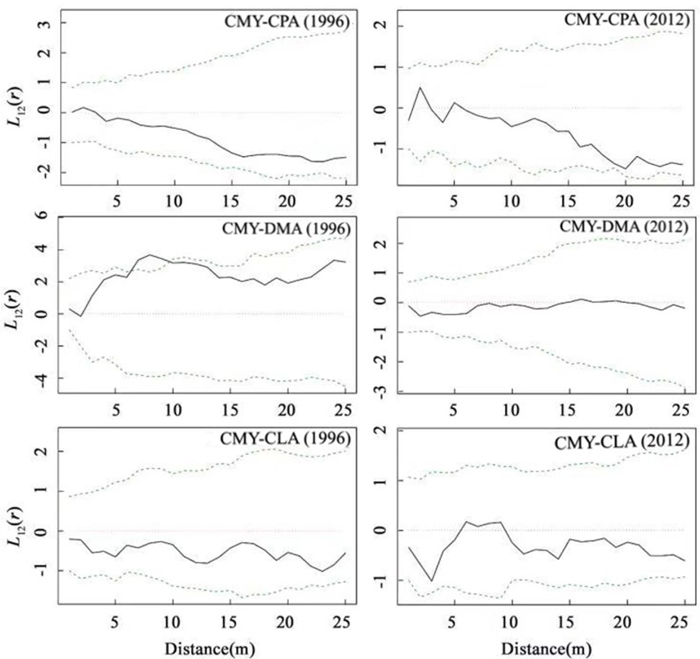
Fig. 4. Bivariate analysis of the spatial patterns of Cyclobalanopsis myrsinifolia and Cyclocarya paliurus, Cyclobalanopsis myrsinifolia and Cunninghamia lanceolata, Cyclobalanopsis myrsinifolia and Daphniphyllum macropodum in 1996 and 2012. The solid line in the panel shows the actual L12(r) value, and dotted lines show the 99% confidence envelope for the pattern expected from a random distribution of plant localities calculated via Monte Carlo simulations. CMY, Cyclobalanopsis myrsinifolia; CPA, Cyclocarya paliurus; CLA, Cunninghamia lanceolata; DMA, Daphniphyllum macropodum.