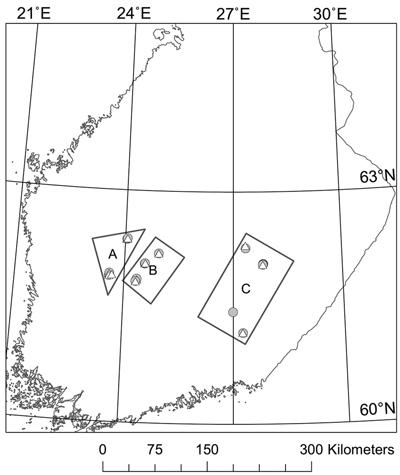
Fig. 1. The location of the survey sites in Finland. Triangles are for mineral soil and circles for peatland sites. Regions A, B and C were operated by different organizations.
| Table 1. Numbers of regeneration sites and inventoried planting spots in peatland and mineral soils (peatlands are presented first) included in the survey done three years after planting in Central Finland. The proportion of seedlings (percentage of seedlings belonging to each category) checked in each geographical area in each category of sample plot-level variables are also presented. | |||
| Geographical area | |||
| Region Aa | Region B | Region C | |
| The number of regeneration sites | 4/6 | 5/5 | 7/3 |
| The number of inventoried planting spots | 369/612 | 474/448 | 611/267 |
| Number of inventoried planting spots ha–1 | 1845/1943 | 1896/1792 | 1721/1780 |
| Site typeb, % of planting spots | |||
| Mesic (Oxalis-Myrtillus type) | 14/0 | ||
| Sub-mesic (Myrtillus type) | 51/81 | 60/95 | 75/84 |
| Sub-dry (Vaccinium type) | 49/19 | 40/5 | 11/16 |
| Soil texture type, % of planting spots | |||
| Medium coarse mineral soil | 14/65 | 3/83 | 14/67 |
| Fine mineral soil | 3/17 | 0/17 | 1/0 |
| Peat | 83/18 | 97/0 | 85/33 |
| Stoniness, % of planting spots | |||
| No stones | 90/77 | 96/51 | 86/69 |
| Normal stoniness | 10/22 | 4/34 | 3/16 |
| Very stony | 0/1 | 0/15 | 5/15 |
| Site preparation method, % of planting spots | |||
| Soil inversion | 83/100 | 13/55 | |
| Spot mounding | 34/86 | 1/0 | 25/12 |
| Ditching and mounding | 66/14 | 16/0 | 62/33 |
| Clear-cut age, % of planting spots | |||
| 3 years | 21/21 | ||
| 4 years | 58/56 | 71/31 | |
| 5 years | 47/67 | 21/23 | 29/69 |
| 6 years | 53/33 | ||
| a Geographical regions A and B were in the Pirkanmaa and region C in South Savo in Finland. b Site type classification is based on Tonteri et al. 1990 and Cajander 1949. | |||
| Table 2. The proportion of Norway spruce seedlings (percentage) belonging to each category of seedling-level variables presented separately for each geographical area on peatland and mineral soils. Peatlands are presented first. In the last column, the average proportions of seedlings belonging to each category on each soil class in the whole data set are presented. Regions are explained in Table 1. | ||||
| Geographical area | ||||
| Region A | Region B | Region C | Average | |
| Number of surviving seedlings ha–1 | 1647/1847 | 1366/1541 | 1237/1440 | 1379/1654 |
| Type of planting spot, % of spots | ||||
| Undisturbed peat | 0.5/0 | 1.5/0 | 3.5/0.5 | 2/0.2 |
| Undisturbed mineral soil | 0/0 | 0/6 | 0.2/1.5 | 0.1/2.5 |
| Cultivated peat | 67/15.5 | 64/0 | 74/30 | 69/13 |
| Cultivated humus | 1.5/5.5 | 0.5/9.5 | 0.2/9 | 0.5/7.5 |
| Cultivated mineral soil | 31/79 | 34/84.5 | 22/58 | 28/76 |
| Ground vegetation cover, % of spots | ||||
| No vegetation | 31/37.5 | 42/42 | 14.5/35 | 29/39 |
| Sparse | 64/61 | 49/53 | 58/60 | 57/57 |
| Dense | 5/1.5 | 9/5 | 27.5/5 | 14/4 |
| Degree of damage, % of seedlings | ||||
| Healthy | 83/90 | 44/56 | 46/46 | 55/69.5 |
| Slightly damaged | 5/4 | 26/28 | 23/33 | 20/18 |
| Weakened | 10/5 | 26/13 | 25/17 | 21/10 |
| Dead | 1/0 | 1/0.5 | 2/0.5 | 1/0.5 |
| Empty mound | 2/1 | 4/2.5 | 4/3.5 | 3/2 |
| Cause of damage, % of seedlings | ||||
| Pine weevil | 6/5 | 39/31 | 22/28 | 23/18 |
| Vole | 0/0 | 5/1 | 23/17 | 11/4 |
| Other reasons | 9/4 | 15/11 | 10/7 | 11/7 |
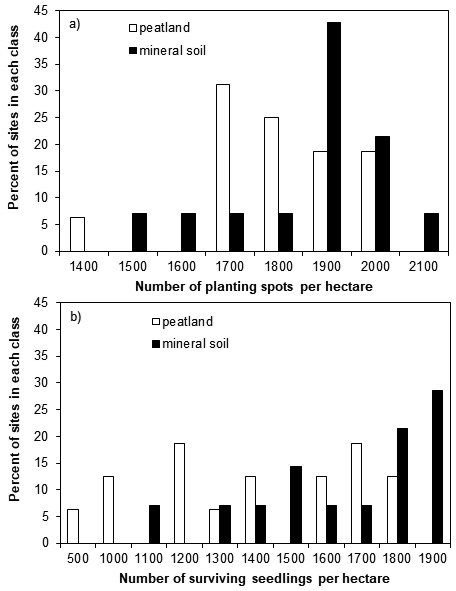
Fig. 2. The number of a) found planting spots and b) surviving Norway spruce seedlings per hectare at regeneration sites on peatland and mineral soil sites three years after planting. Each bar presents the percentage of sites belonging to each class.
| Table 3. The model for the survival probability of Norway spruce seedlings three years after planting in peatland (Peat) and mineral soil (Mineral) sites. Estimates, their standard errors (SE) and the significance of parameters of fixed effects and the variances of random effects (regeneration site and sample plot within a regeneration site) in a generalized linear mixed model are given. Soil classes Peat and Mineral were used as dummy variables. The fixed and random effect variances were estimated separately for each of them. In the final model, the fixed effects were the type of planting spot (reference category “Cultivated mineral soil”) and the ground vegetation cover around a seedling (reference category “No vegetation”). CD is the coefficient of determination for different random effects. | ||||
| Effect type | Estimate (SE) | t Value | p-value | |
| Fixed effects | ||||
| Peat | 1.87 (0.37) | 5.01 | <0.001 | |
| Peat × Ground vegetation cover | Dense | –0.87 (0.28) | –3.07 | <0.001 |
| Sparse | 0.29 (0.20) | 1.49 | 0.137 | |
| Peat × Type of planting spot | Undisturbed spot | –0.58 (0.53) | –1.09 | 0.276 |
| Cultivated organic spot | –0.61 (0.27) | –2.28 | 0.023 | |
| Mineral | 3.12 (0.47) | 6.69 | <0.001 | |
| Mineral × Ground vegetation cover | Dense | –1.09 (0.47) | –2.31 | 0.021 |
| Sparse | 0.13 (0.25) | 0.53 | 0.597 | |
| Variances of random effects | Estimate (SE) | CD | ||
| Regeneration site (Peat) | 0.99 (0.43) | 0.24 | ||
| Sample plot (Peat) | 0.54 (0.18) | 0.13 | ||
| Regeneration site (Mine) | 1.77 (0.97) | –0.05 | ||
| Sample plot (Mine) | 1.26 (0.42) | 0.13 | ||
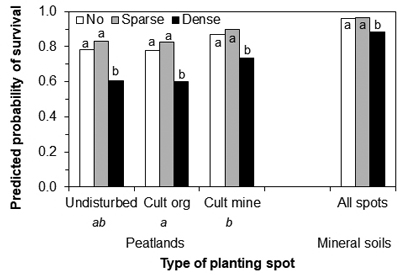
Fig. 3. The predicted probability of Norway spruce seedling survival (healthy and slightly damaged) on the different types of planting spots (only for peatland) and the ground vegetation cover classes on peatland and mineral soil sites. Undisturbed = planting spot on undisturbed soil, Cult org = cultivated (mound or patch) planting spot covered by peat, Cult mine = cultivated (mound or patch) planting spot covered by mineral soil. Letters below the type of planting spot on peatland indicate the statistically significant differences between types. Letters above bars indicate statistically significant differences between ground vegetation classes within a type of planting spot.
| Table 4. The model for the pine weevil feeding damage in Norway spruce seedlings three years after planting. In the table, estimates, standard errors (SE) and the significance of parameters of fixed effects and the variances of random effects (geographical area, regeneration site and sample plot within a regeneration site) in a generalized linear mixed model are given. Soil classes [peatland (Peat) and mineral soil (Mineral)] were used as dummy variables and the fixed and random effect variances were estimated separately for each of them. In the final model, the fixed effects were clear-cut age (continuous), the site type (reference category “Sub-dry”), the ground vegetation cover around a seedling (reference category “No vegetation”) and the type of planting spot (reference category “Cultivated mineral soil”). CD is the coefficient of determination for different random effects. | ||||
| Effect type | Estimate (SE) | t Value | p-value | |
| Fixed effects | ||||
| Peat | 3.02 (1.93) | 1.56 | 0.144 | |
| Peat × Clear-cut age | –1.66 (0.40) | –4.12 | <0.001 | |
| Peat × Site type | Mesic | –2.29 (1.26) | –1.81 | 0.070 |
| Sub-mesic | 0.33 (0.40) | 0.81 | 0.418 | |
| Peat × Ground vegetation cover (V) | Dense | 2.91 (0.76) | 3.80 | <0.001 |
| Sparse | 1.85 (0.67) | 2.75 | 0.006 | |
| Peat × Type of planting spot (S) | Undisturbed soil (U) | 1.60 (0.62) | 2.58 | 0.010 |
| Cultivated organic (C) | 2.20 (0.68) | 3.24 | 0.001 | |
| Peat × V × S | U and dense | –0.59 (2.20) | –0.27 | 0.789 |
| C and dense | –2.18 (0.183) | –2.61 | 0.009 | |
| U and sparse | 0 | |||
| C and sparse | –0.92 (0.71) | –1.30 | 0.195 | |
| Mineral | 4.62 (1.35) | 3.41 | 0.006 | |
| Mineral × Clear-cut age | –1.81 (0.30) | –6.04 | <0.001 | |
| Mineral × Ground vegetation cover (V) | Dense | 2.65 (0.50) | 5.29 | <0.001 |
| Sparse | 1.31 (0.25) | 5.25 | <0.001 | |
| Mineral × Type of planting spot | Undisturbed soil | 1.11 (0.50) | 2.22 | 0.027 |
| Cultivated organic | 2.34 (0.33) | 7.01 | <0.001 | |
| Variances of random effects | Estimate (SE) | CD | ||
| Regeneration site (Peat) | 1.04 (0.50) | 0.54 | ||
| Sample plot (Peat) | 0.74 (0.23) | –0.15 | ||
| Regeneration site (Mine) | 0.46 (0.30) | 0.79 | ||
| Sample plot (Mine) | 0.90 (0.34) | –0.15 | ||
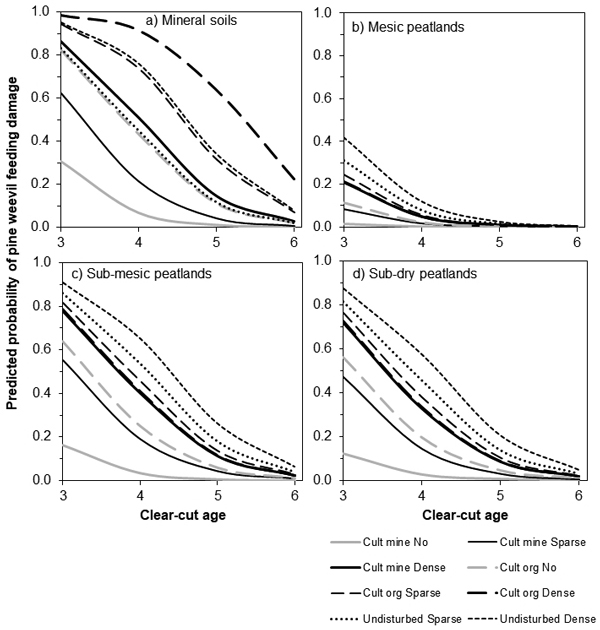
Fig. 4. The relationship of the clear-cut age and predicted probability of pine weevil feeding damage on Norway spruce seedlings in different classes in the ground vegetation cover and types of soil planting spots on (a) mineral soil and (b–d) peatland. On peatland, the predicted probabilities are presented also for (b) mesic, (c) sub-mesic and (d) sub-dry site types. In the data, there were no cases for undisturbed soil with no ground vegetation, thus those lines are not presented. Cult = cultivated (mound or patch) planting spot, Undisturbed = seedling planted in undisturbed soil, mine = planting spot covered by mineral soil, org = planting spot covered by peat in peatlands and humus in mineral soils.
| Table 5. The model for the presence of ground vegetation around a Norway spruce seedling three years after planting. Estimates, standard errors (SE) and the significance of parameters of fixed effects and the variances of random effects (regeneration site and sample plot within a regeneration site) in a generalized linear mixed model are given. Soil classes [peatland (Peat) and mineral soil (Mineral)] were used as dummy variables and the fixed and random effect variances were estimated separately for each of them. In the final model, fixed effects were the clear-cut age (continuous), the site type (reference category “Sub-dry”), the mechanical site preparation (MSP) method (reference category “Spot mounding”) and the type of planting spot (reference category “Cultivated mineral soil”). CD is the coefficient of determination for different random effects. | ||||
| Effect type | Estimate (SE) | t Value | p-value | |
| Fixed effects | ||||
| Peat | 1.21 (0.66) | 1.83 | 0.090 | |
| Peat × Site type (T) | Mesic (OMT) | 14.77 (476) | 0.03 | 0.975 |
| Sub-mesic (MT) | –0.16 (0.54) | –0.29 | 0.769 | |
| Peat × MSP | Soil inversion (I) | –0.28 (0.76) | –0.36 | 0.717 |
| Ditching and mounding (D) | –0.26 (0.72) | –0.36 | 0.716 | |
| Peat × Type of planting spot (S) | Undisturbed soil (U) | 31.59 (0) | Infty | <0.001 |
| Cultivated peat (C) | 0.47 (0.65) | 0.71 | 0.476 | |
| Peat × T × S | OMT and C | –9.93 (476) | –0.02 | 0.983 |
| MT and U | 23.14 (0) | Infty | <0.001 | |
| MT and C | 1.49 (0.56) | 2.64 | 0.008 | |
| Peat × MSP × S | I and U | 5.46 (0) | Infty | <0.001 |
| I × C | –1.07 (0.75) | –1.43 | 0.152 | |
| D × U | 12.04 (0) | Infty | <0.001 | |
| D × C | –1.21 (0.79) | –1.53 | 0.125 | |
| Mineral | –1.11 (0.91) | –1.22 | 0.249 | |
| Mineral × Clear-cut age (A) | 0.33 (0.19) | 1.72 | 0.086 | |
| Mineral × Type of planting spot (S) | Undisturbed soil (U) | 25.74 (0) | Infty | <0.001 |
| Cultivated humus (C) | 0.92 (0.27) | 3.39 | <0.001 | |
| Variances of random effects | Estimate (SE) | CD | ||
| Regeneration site (Peat) | 1.10 (0.52) | 0.41 | ||
| Sample plot (Peat) | 1.24 (0.31) | 0.16 | ||
| Regeneration site (Mine) | 0.16 (0.12) | 0.60 | ||
| Sample plot (Mine) | 0.87 (0.22) | –0.07 | ||
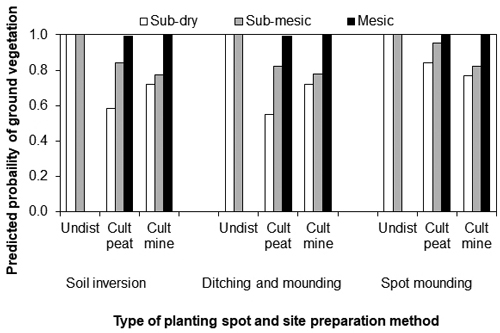
Fig. 5. The predicted probability that there would be ground vegetation cover around a Norway spruce seedling three years after the planting for different types of sites, planting spots and mechanical site preparation methods on peatland sites. In the data, there were no cases where seedlings had been planted on undisturbed soil on mesic sites, thus those bars are not presented. Cult = cultivated (mound or patch) planting spot, Undist = a seedling planted in undisturbed soil, mine = planting spot covered by mineral soil, peat = planting spot covered by peat.
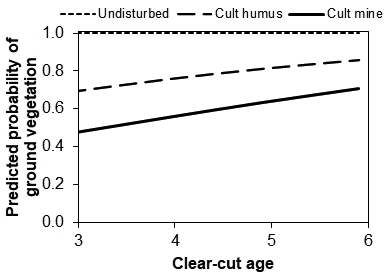
Fig. 6. The effect of clear-cut age on the predicted probability that there would be ground vegetation cover around a Norway spruce seedling three years after planting in different types of planting spots in mineral soils.