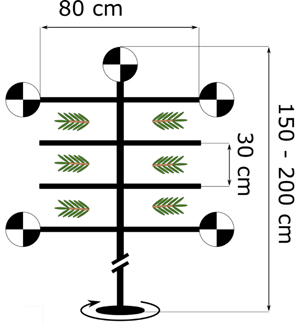
Fig. 1. Schematic of the shoot holder that was used to suspend shoots in the experiment. The shoots were fixed to the frame with thread.
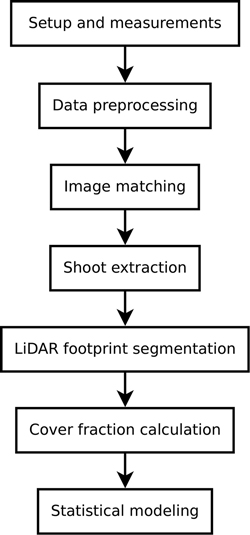
Fig. 2. Flowchart of the proposed method. After measurements and data preprocessing is complete, the TLS intensity image and reference photographs are matched using five targets. Shoot pixels are extracted from the intensity image, and subsequently each LiDAR return’s footprint that comes from a shoot is segmented in the reference photograph. The segmented photograph is then used to calculate the per-pulse cover fraction, and the data is used to create a regression model to predict cover fraction from TLS return intensity.
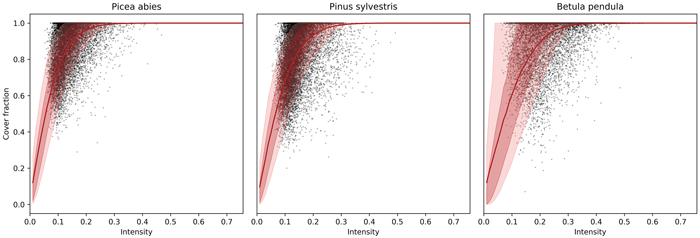
Fig. 3. Scatterplot of cover fraction against TLS return intensity with prediction by beta regression for our study species. The red line indicates the mean of the posterior predictive distribution, and the dark and light red areas indicate the 50% and 90% credible intervals, respectively. The data points were thinned to 1% of the original density. View larger in new window/tab.
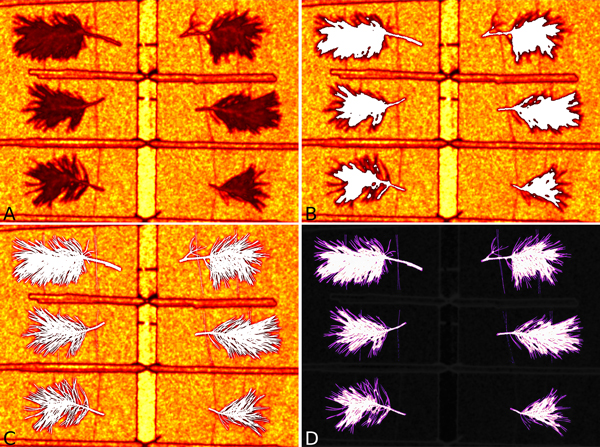
Fig. 4. Illustration of Pinus sylvestris shoots visible by the TLS. A. The intensity image of shoots. B. Points located on the shoot were colored white. C. The shoot silhouette from the thresholded photograph was colored white. D. Difference between the thresholded photograph and the shoot points, with the white area highlighting a match in both images and purple indicating shoot portions only covered by the photograph.