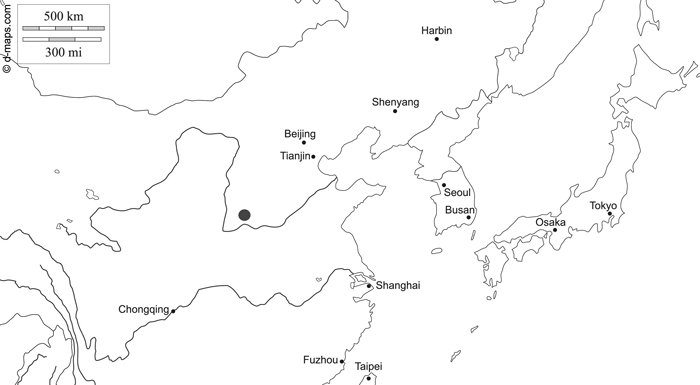
Fig. 1. Map of northern China indicating the research area of Zhongtiaoshan forest region with a grey large dot (d-maps 2020, modified). East Asia free map, free blank map, free outline map, free base map hydrography, states, main cities, names. Gap https://d-maps.com/carte.php?num_car=28780&lang=en. Accessed 19 January 2021.
| Table 1. Tree species-specific information of sample trees of the investigated tree species Pinus tabuliformis, Pinus armandii, Larix principis-rupprechtii, Quercus liaotungensis, Quercus variabilis, Quercus aliena and Betula platyphylla | ||||||
| tree species | sample trees (n) | elevation (m a.s.l.) | tree age (y) | tree height (m) | ||
| mean | sd | mean | sd | |||
| P. tabuliformis | 27 | 1187–1677 | 69 | 17 | 14.55 | 2.40 |
| P. armandii | 27 | 1338–1897 | 57 | 12 | 14.68 | 2.47 |
| L. principis-rupprechtii | 27 | 1191–1916 | 34 | 7 | 16.86 | 2.62 |
| Q. liaotungensis | 27 | 1283–1956 | 57 | 30 | 15.88 | 1.84 |
| Q. variabilis | 26 | 750–1223 | 60 | 14 | 18.20 | 3.41 |
| Q. aliena | 27 | 932–1350 | 79 | 16 | 17.45 | 1.76 |
| B. platyphylla | 27 | 1519–1927 | 38 | 18 | 16.18 | 1.68 |
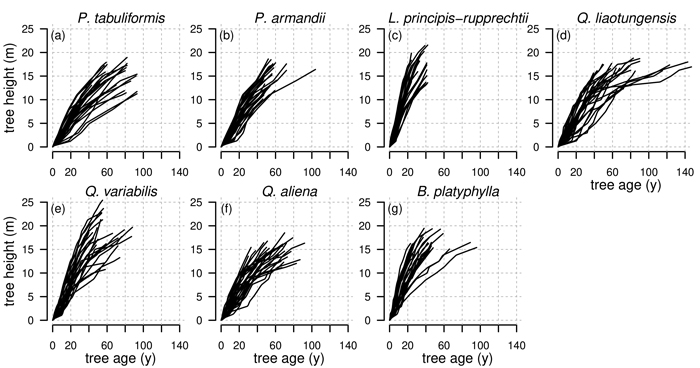
Fig. 2. Observed tree heights for all investigated tree species Pinus tabuliformis, Pinus armandii, Larix principis-rupprechtii, Quercus liaotungensis, Quercus variabilis, Quercus aliena and Betula platyphylla from stem analysis. Height of annual shoots are estimated based on the method from Carmean (1972).
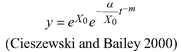
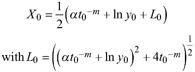
| Table 2. Model formulations of the two base functions and the five resulting dynamic equations used to fit tree species specific families of height growth curves. | ||||
| base function | site parameters | solution for X with initial values (y0, t0) | dynamic equation | ID |
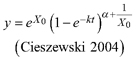
| | L1 | |||
| L2 | ||||
| | L3 | |||
| R1 | ||||
| R2 | ||||
| Table 3. Akaike information criterion (AIC), root mean square error (RMSE) and bias (ē) for all fitted height growth models based on the five dynamic equations and fitted with both approaches the nonlinear mixed-effects model approach (NLME) and the nonlinear model approach with dummy variables (NLFE) to all investigated tree species Pinus tabuliformis, Pinus armandii, Larix principis-rupprechtii, Quercus liaotungensis, Quercus variabilis, Quercus aliena and Betula platyphylla | ||||||||||
| tree species | approach | model | AIC | RMSE | ē | approach | model | AIC | RMSE | ē |
| P. tabuliformis | NLME | L1 | –4596.3 | 34.63 | 28.79 | NLFE | L1 | –4465.8 | 34.61 | 28.7 |
| L2 | –4541 | 34.59 | 28.75 | L2 | –4446.7 | 34.6 | 28.68 | |||
| L3 | –4337.3 | 34.4 | 28.63 | L3 | –4305.2 | 34.39 | 28.55 | |||
| R1 | –4650.7 | 34.5 | 28.63 | R1 | –4716 | 34.48 | 28.56 | |||
| R2 | –4574.5 | 34.44 | 28.58 | R2 | –4657.8 | 34.46 | 28.53 | |||
| P. armandii | NLME | L1 | –2744.4 | 26.12 | 21.68 | NLFE | L1 | –2636.1 | 26.19 | 21.69 |
| L2 | –2703.5 | 26.11 | 21.67 | L2 | –2610.7 | 26.16 | 21.65 | |||
| L3 | –2583.1 | 26.05 | 21.64 | L3 | –2525 | 26.07 | 21.58 | |||
| R1 | –2794.8 | 25.96 | 21.49 | R1 | –2818.2 | 25.99 | 21.44 | |||
| R2 | –2739.2 | 25.94 | 21.48 | R2 | –2774 | 25.97 | 21.42 | |||
| L. principis-ruprpechtii | NLME | L1 | –380.1 | 10.68 | 8.65 | NLFE | L1 | –332.8 | 10.76 | 8.67 |
| L2 | –378.9 | 10.67 | 8.64 | L2 | –333.4 | 10.78 | 8.68 | |||
| L3 | –350.1 | 10.58 | 8.58 | L3 | –324.3 | 10.67 | 8.61 | |||
| R1 | –408.1 | 10.45 | 8.37 | R1 | –475.7 | 10.5 | 8.38 | |||
| R2 | –402.9 | 10.44 | 8.36 | R2 | –437.2 | 10.47 | 8.3 | |||
| Q. liaotungensis | NLME | L1 | –2104.9 | 43.17 | 33.75 | NLFE | L1 | –2111.3 | 43.27 | 33.68 |
| L2 | –2110.8 | 43.18 | 33.73 | L2 | –2118.6 | 43.29 | 33.68 | |||
| L3 | –2116.8 | 43.09 | 33.63 | L3 | –2169.9 | 43.28 | 33.64 | |||
| R1 | –2210 | 42.82 | 33.41 | R1 | –2232.1 | 42.68 | 33.21 | |||
| R2 | –2200.2 | 42.86 | 33.41 | R2 | –2224.9 | 42.8 | 33.28 | |||
| Q. variabilis | NLME | L1 | –1322.1 | 26.21 | 21.5 | NLFE | L1 | –1336.5 | 26.32 | 21.56 |
| L2 | –1340.8 | 26.2 | 21.46 | L2 | –1352.2 | 26.34 | 21.54 | |||
| L3 | –1345.6 | 26.1 | 21.35 | L3 | –1370.9 | 26.24 | 21.41 | |||
| R1 | –1415 | 25.91 | 21.17 | R1 | –1492.5 | 25.94 | 21.12 | |||
| R2 | –1439.4 | 25.91 | 21.14 | R2 | –1514 | 25.99 | 21.12 | |||
| Q. aliena | NLME | L1 | –2469.6 | 30.49 | 25.3 | NLFE | L1 | –2536.3 | 30.46 | 25.2 |
| L2 | –2464.5 | 30.48 | 25.29 | L2 | –2536.2 | 30.48 | 25.2 | |||
| L3 | –2417.8 | 30.37 | 25.19 | L3 | –2501.7 | 30.38 | 25.13 | |||
| R1 | –2555.2 | 30.28 | 25.09 | R1 | –2656.4 | 30.22 | 24.97 | |||
| R2 | –2538 | 30.27 | 25.08 | R2 | –2639.7 | 30.27 | 25 | |||
| B. platyphylla | NLME | L1 | –207.1 | 22.66 | 16.54 | NLFE | L1 | –238.3 | 22.77 | 16.56 |
| L2 | –187.6 | 22.64 | 16.51 | L2 | –231.7 | 22.78 | 16.55 | |||
| L3 | –118.3 | 22.49 | 16.35 | L3 | –188.6 | 22.64 | 16.38 | |||
| R1 | –224.6 | 22.53 | 16.34 | R1 | –286.4 | 22.68 | 16.4 | |||
| R2 | –199.4 | 22.51 | 16.3 | R2 | –271.2 | 22.72 | 16.39 | |||
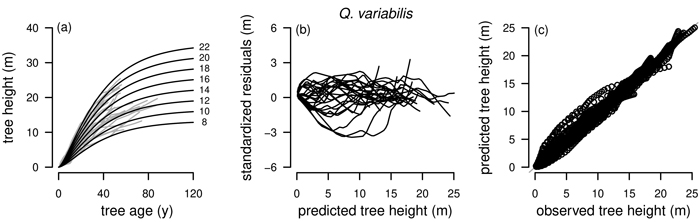
Fig. 3. Plots of the fitted nonlinear model with dummy variables (NLFE) R2 to height growth data from Quercus variabilis. a): family of polymorphic height growth curves with varying asymptotes; numbers after each height growth curve indicate corresponding modelled tree height at base age 40, grey lines in the background indicate observed tree height values. b): residual plots of standardized residuals vs. predicted tree heights. c): predicted tree heights vs. observed tree heights.
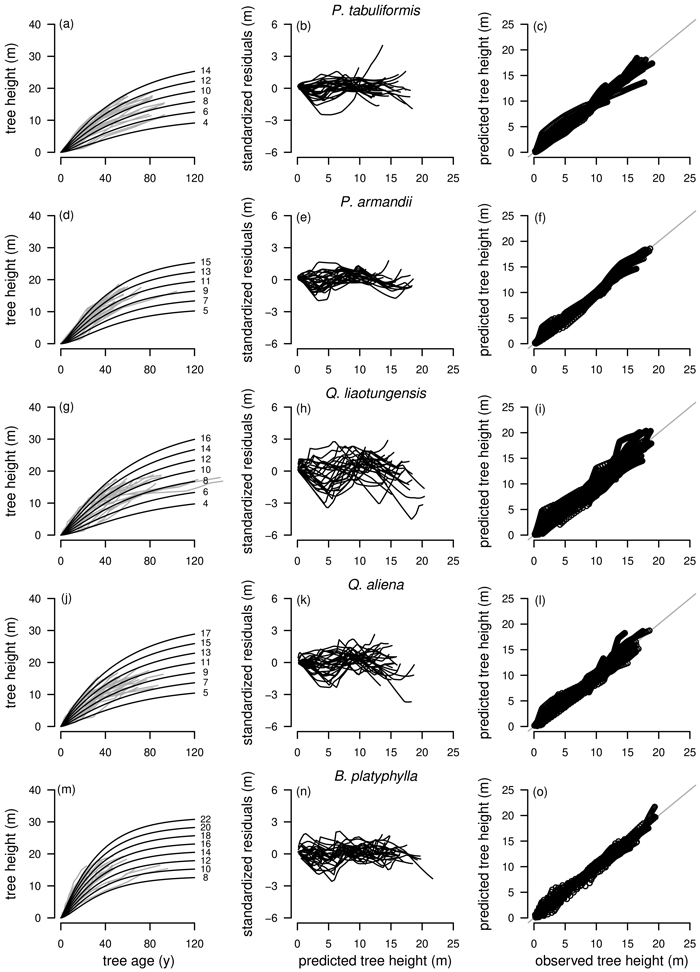
Fig. 4. Tree species Pinus tabuliformis, Pinus armandii, Quercus liaotungensis, Quercus aliena and Betula platyphylla are organized in rows, plot types of the fitted nonlinear models with dummy variables (NLFE) R1 to height growth data are organized in columns. First column: families of polymorphic height growth curves with varying asymptotes; numbers after each height growth curve indicate corresponding modelled tree height at base age 40, grey lines in the background indicate observed tree height values. Second column: residual plots of standardized residuals vs. predicted tree heights. Third column: predicted tree heights vs. observed tree heights.
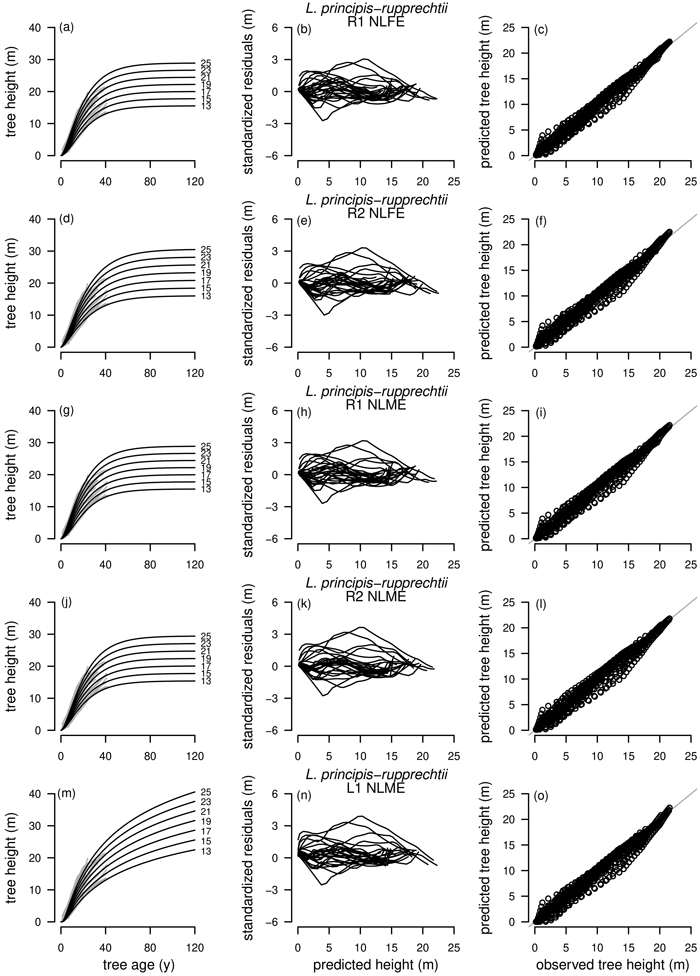
Fig. 5. Plot types of the fitted nonlinear models with dummy variables (NLFE) and nonlinear mixed-effects models (NLME) using the dynamic equations R1, R2 and L1 to height growth data of Larix principis-rupprechtii are organized in columns. First column: families of polymorphic height growth curves with varying asymptotes; numbers after each height growth curve indicate corresponding modelled tree height at base age 40, grey lines in the background indicate observed tree height values. Second column: residual plots of standardized residuals vs. predicted tree heights. Third column: predicted tree heights vs. observed tree heights.
| Table 4. Estimated parameter values for the best fitting height growth model of each investigated tree species Pinus tabuliformis, Pinus armandii, Larix principis-rupprechtii, Quercus liaotungensis, Quercus variabilis, Quercus aliena and Betula platyphylla with standard errors, t-statistics and p-values. | ||||||
| tree species | model | parameter | estimate | standard error | t-value | p-value |
| P. tabuliformis | R1 NLFE | X | 2.6284 | 0.055 | 47.74 | <0.0001 |
| k | 0.0175 | 0.0007 | 26.48 | <0.0001 | ||
| α | 3.5901 | 0.0334 | 107.38 | <0.0001 | ||
| P. armandii | R1 NLFE | X | 2.8004 | 0.0566 | 49.43 | <0.0001 |
| k | 0.0249 | 0.0011 | 23.19 | <0.0001 | ||
| α | 4.2164 | 0.061 | 69.1 | <0.0001 | ||
| L. principis-rupprechtii | L1 NLME | X | 4.1185 | 0.0835 | 49.34 | <0.0001 |
| α | 32.7942 | 0.5528 | 59.33 | <0.0001 | ||
| m | 0.5198 | 0.0212 | 24.52 | <0.0001 | ||
| Q. liaotungensis | R1 NLFE | X | 3.1125 | 0.0713 | 43.65 | <0.0001 |
| k | 0.0167 | 0.0011 | 15.02 | <0.0001 | ||
| α | 3.872 | 0.0675 | 57.33 | <0.0001 | ||
| Q. variabilis | R2 NLFE | X | 3.0037 | 0.0676 | 44.4 | <0.0001 |
| k | 0.0318 | 0.0014 | 23.17 | <0.0001 | ||
| α | 1.1591 | 0.0335 | 34.61 | <0.0001 | ||
| Q. aliena | R1 NLFE | X | 2.9198 | 0.0647 | 45.14 | <0.0001 |
| k | 0.0182 | 0.0011 | 16.68 | <0.0001 | ||
| α | 3.419 | 0.0459 | 74.54 | <0.0001 | ||
| B. platyphylla | R1 NLFE | X | 2.6749 | 0.1198 | 22.32 | <0.0001 |
| k | 0.0326 | 0.0023 | 13.88 | <0.0001 | ||
| α | 3.9128 | 0.0843 | 46.42 | <0.0001 | ||